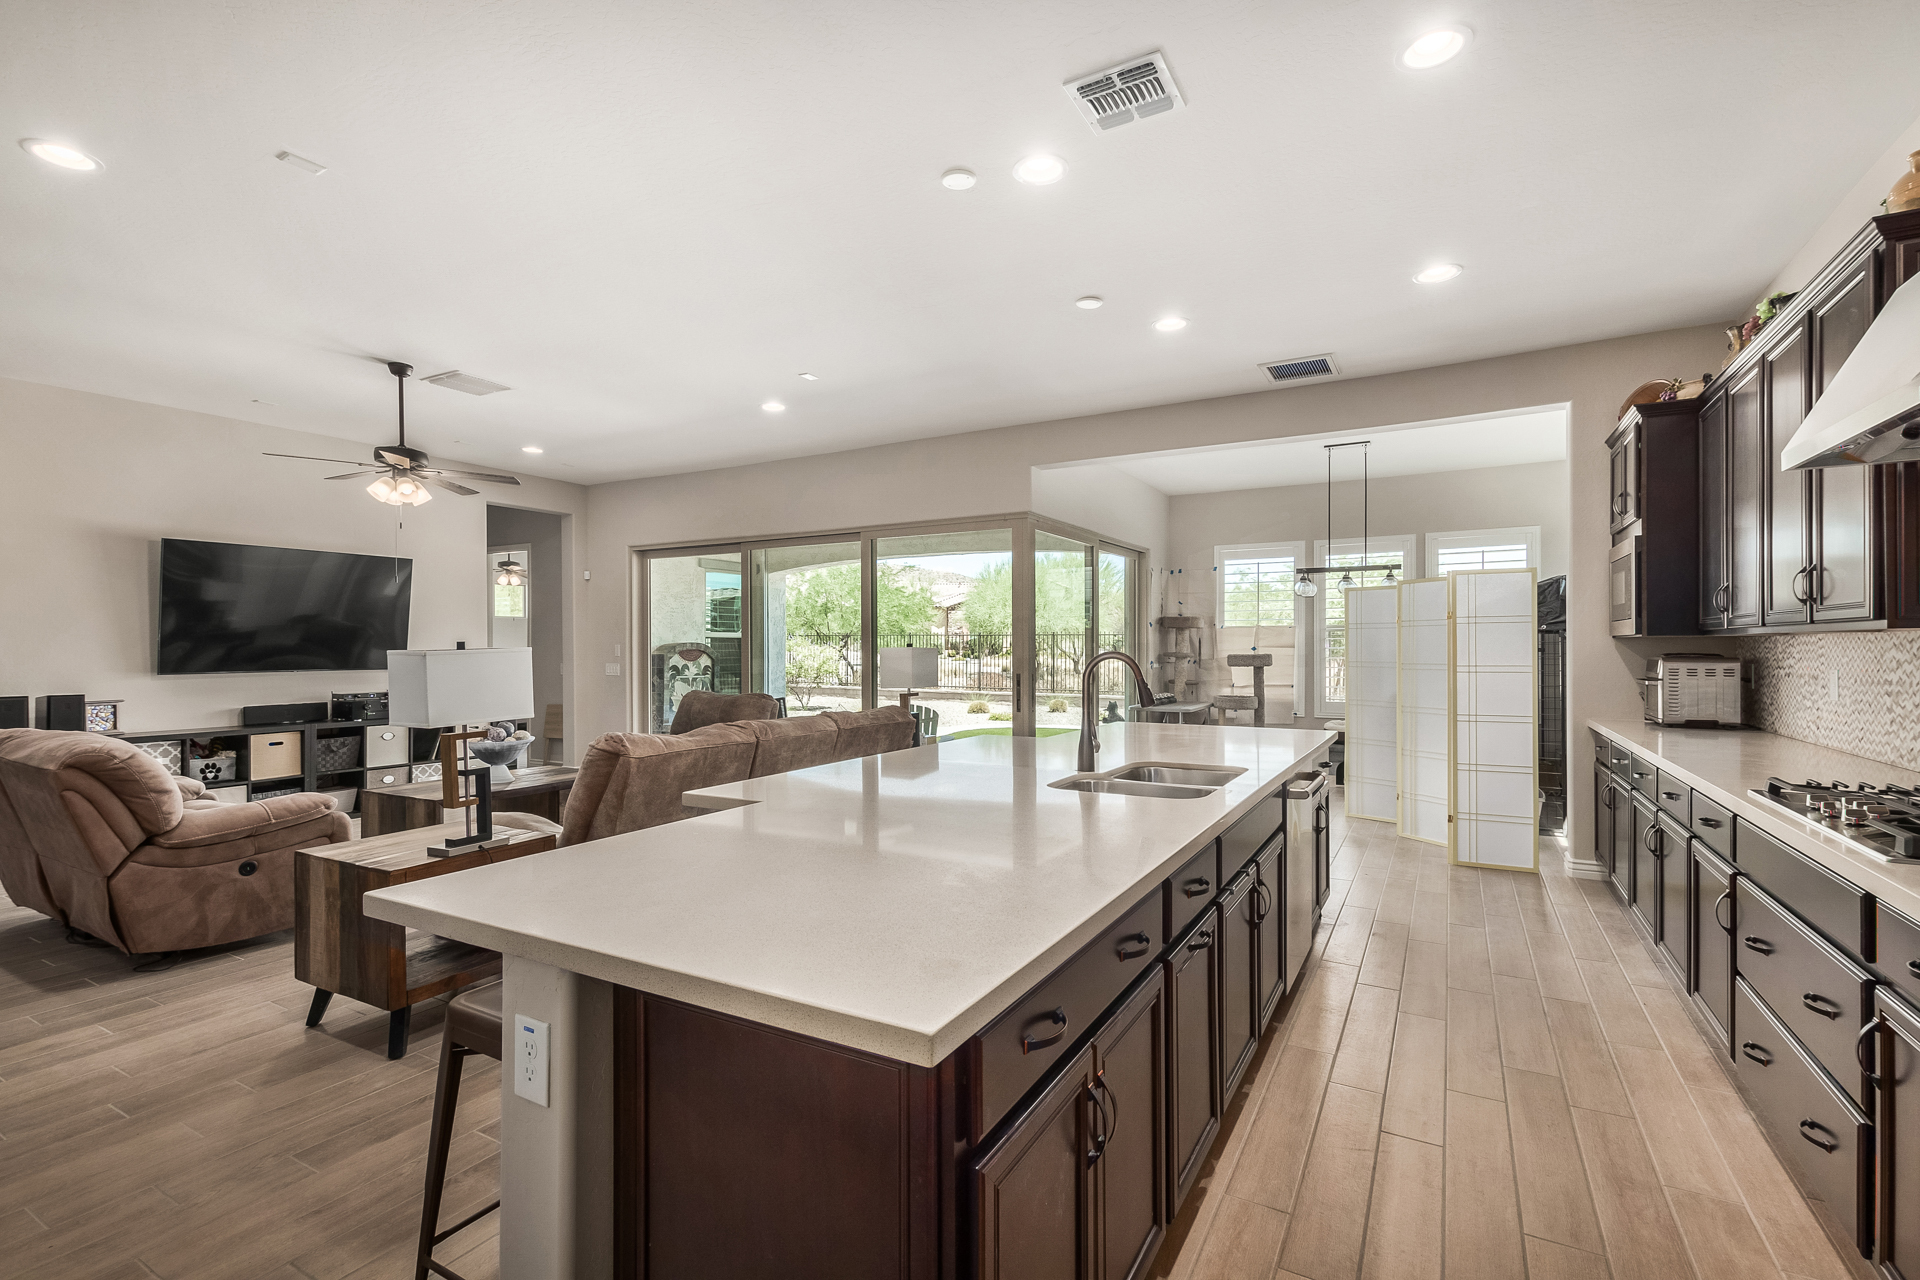
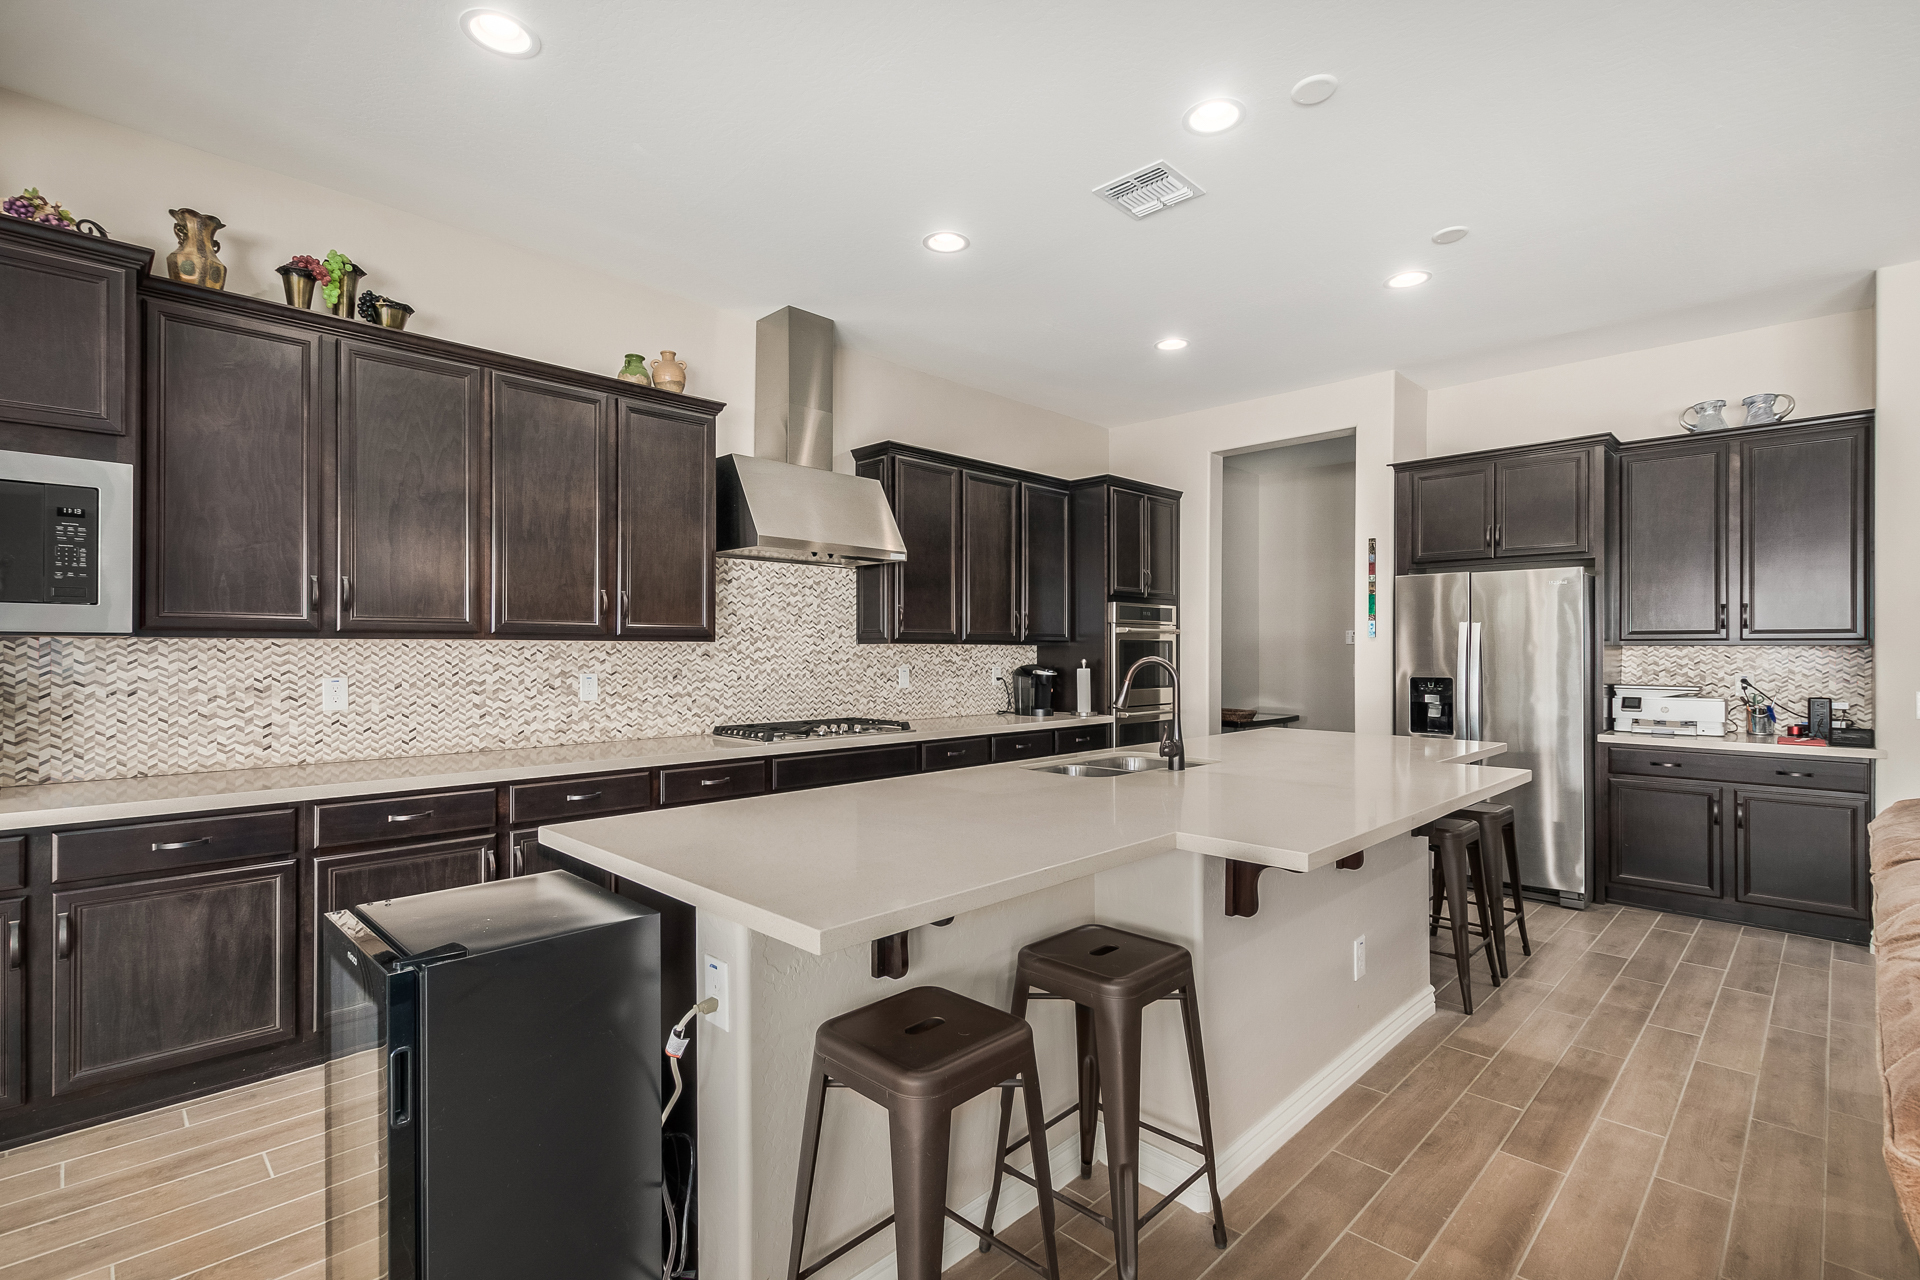
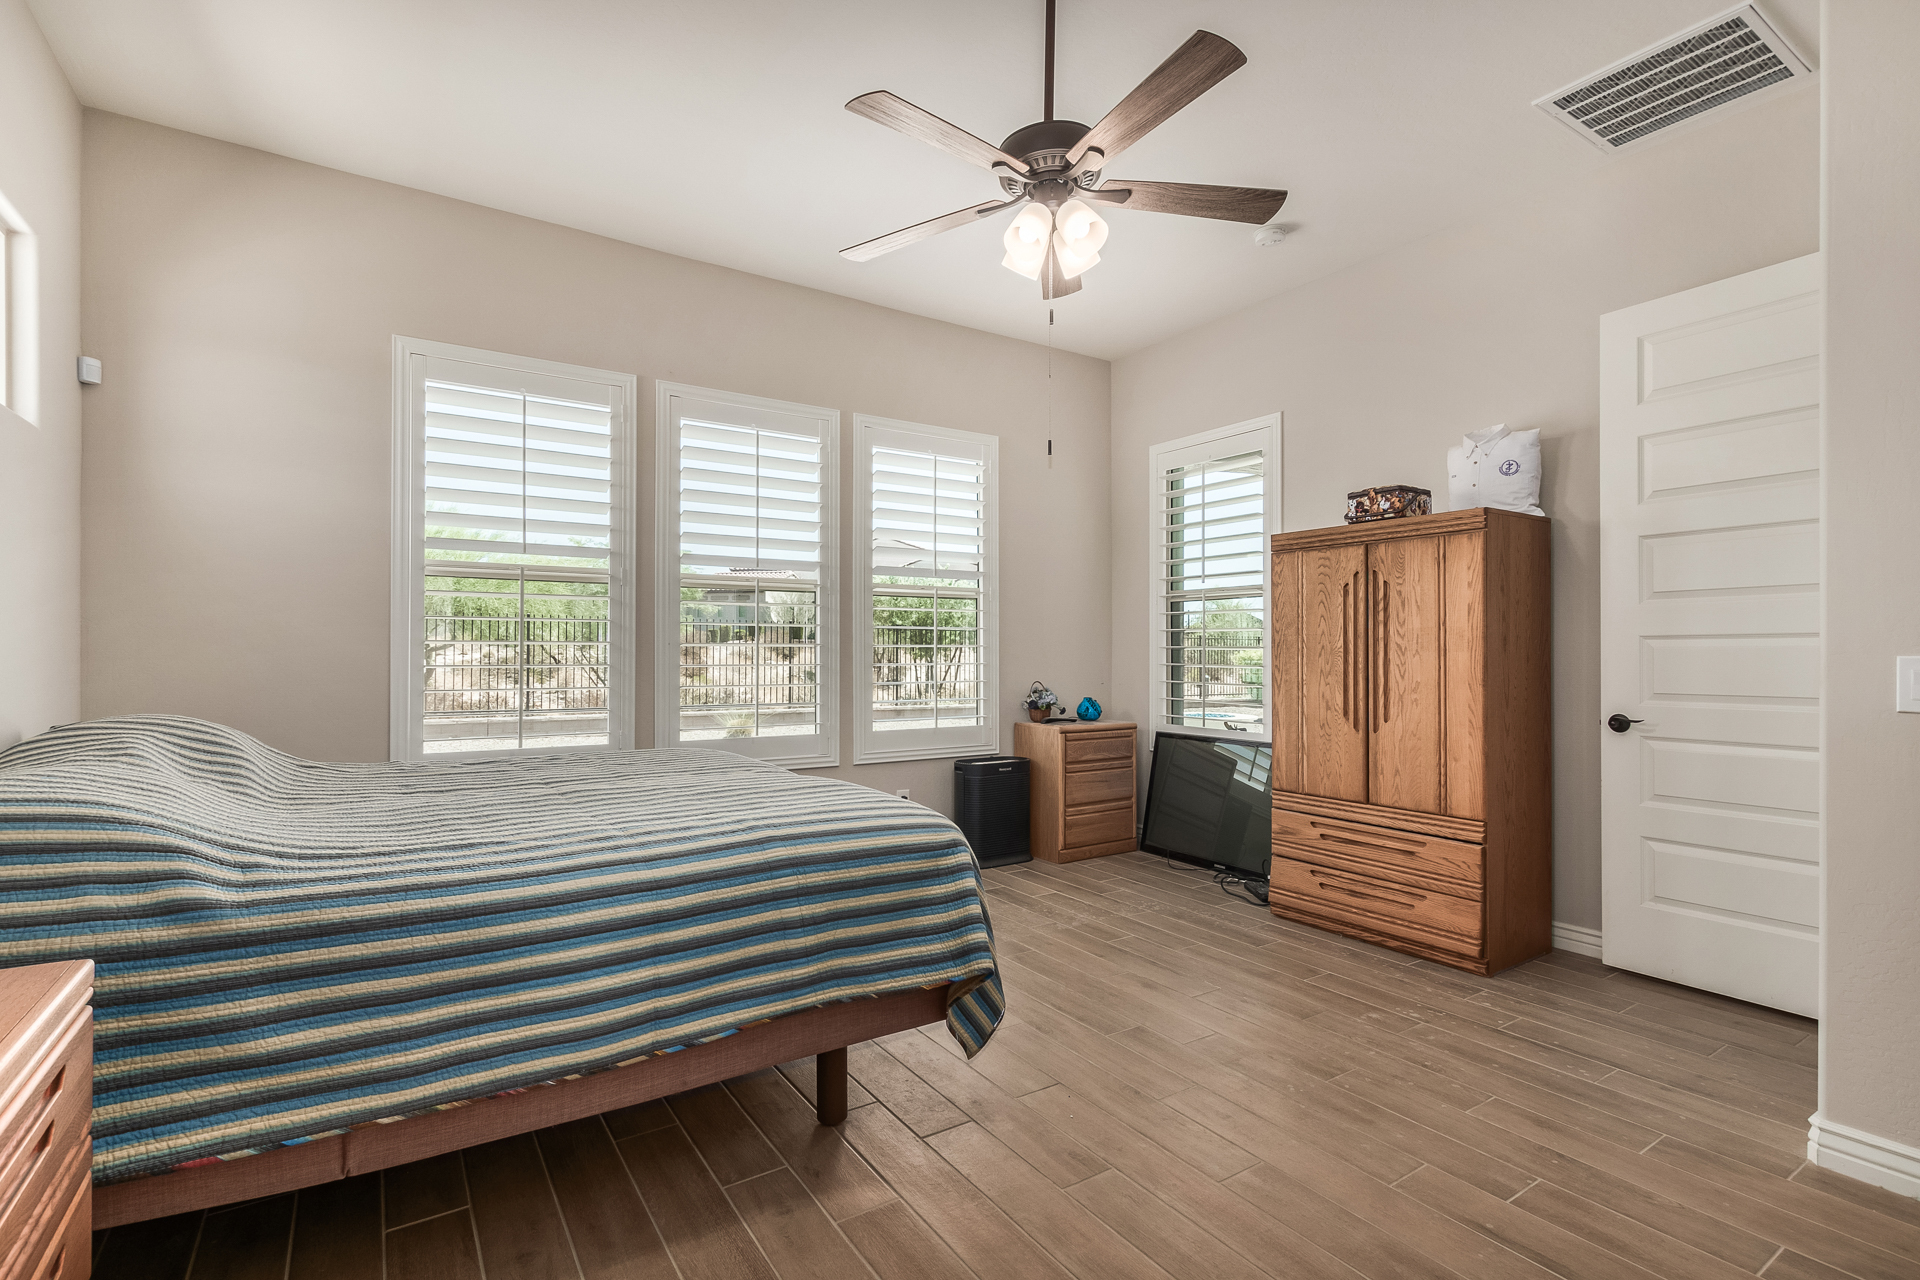
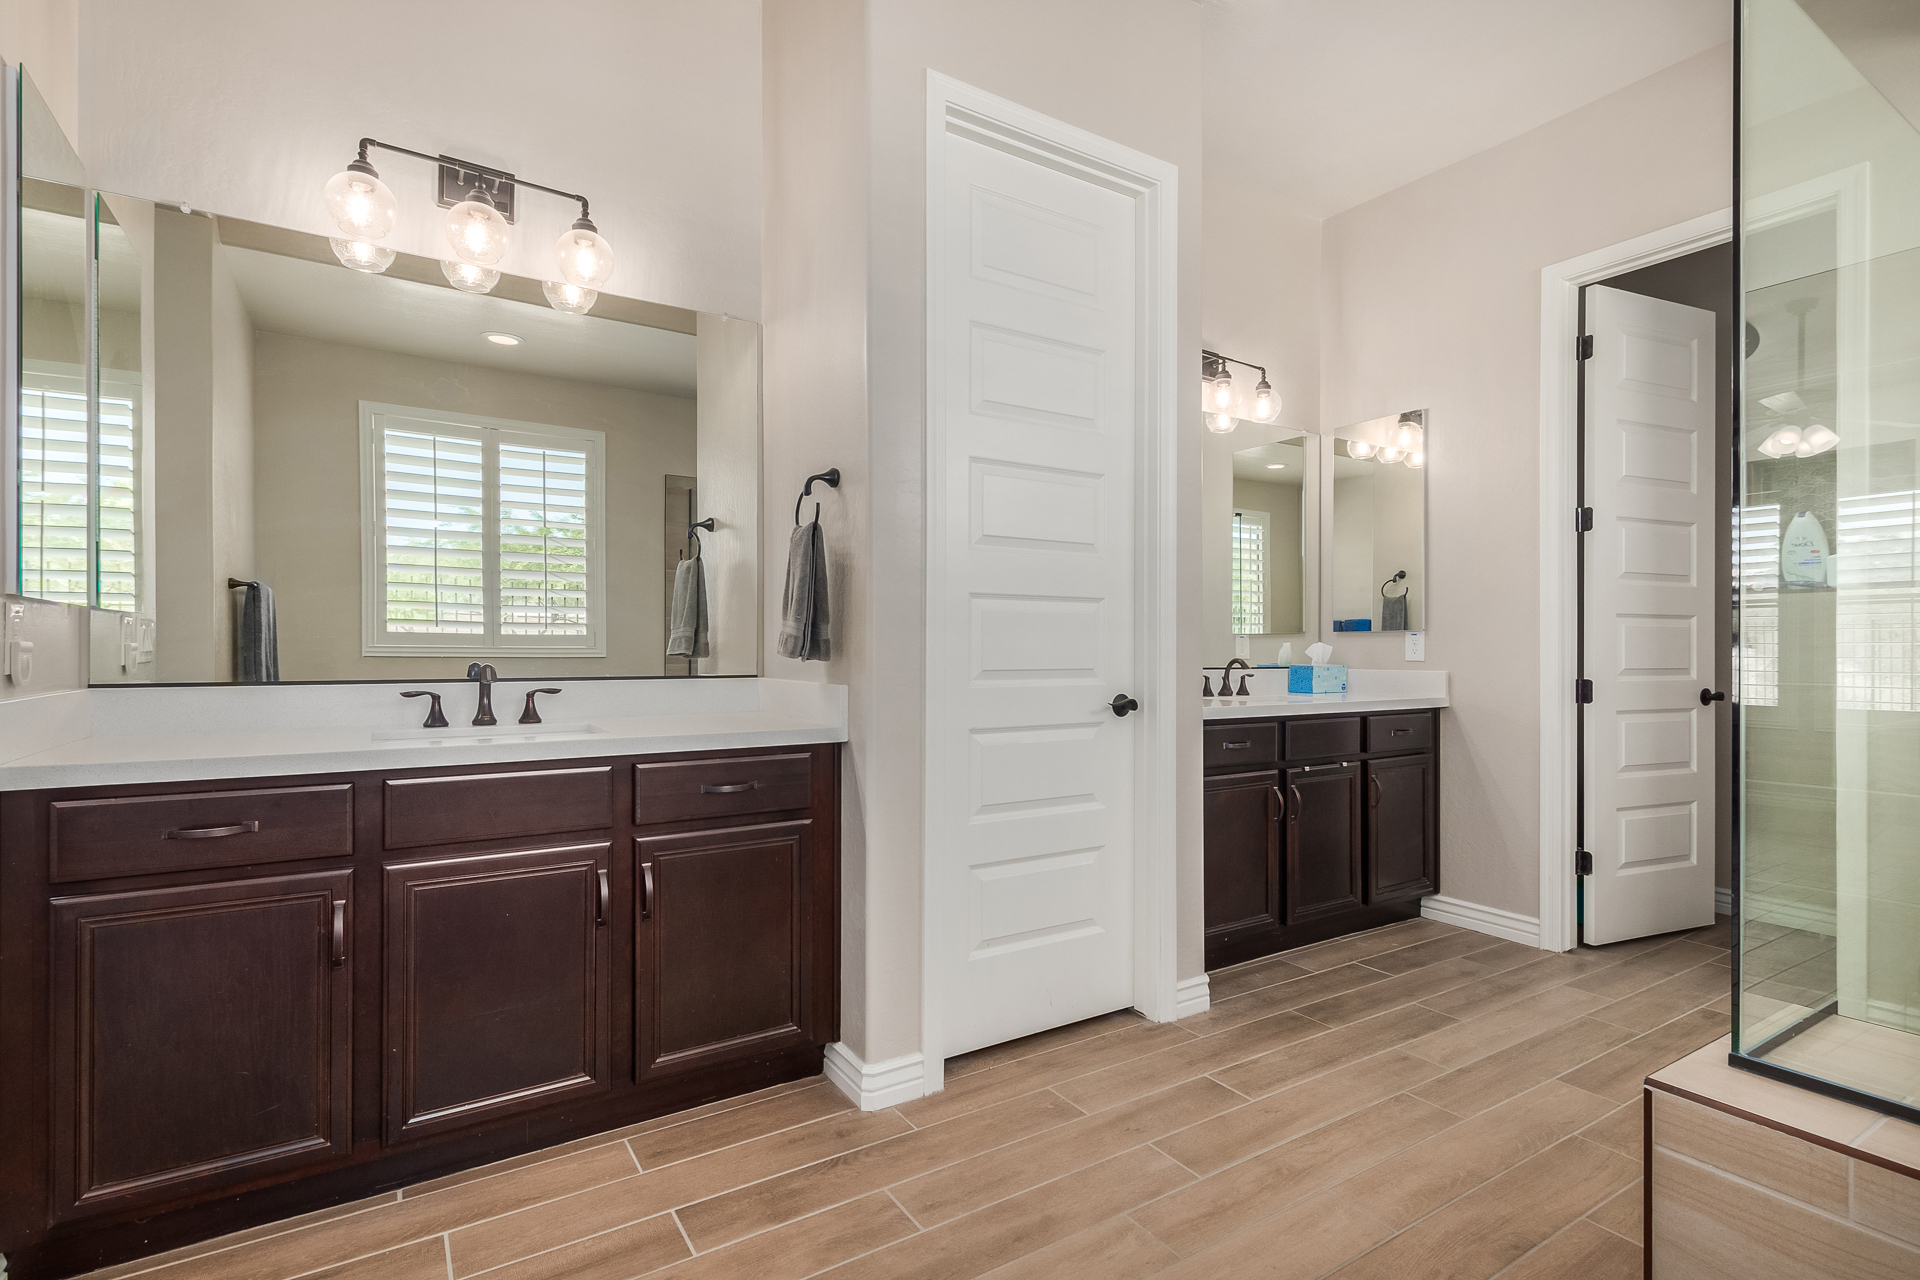
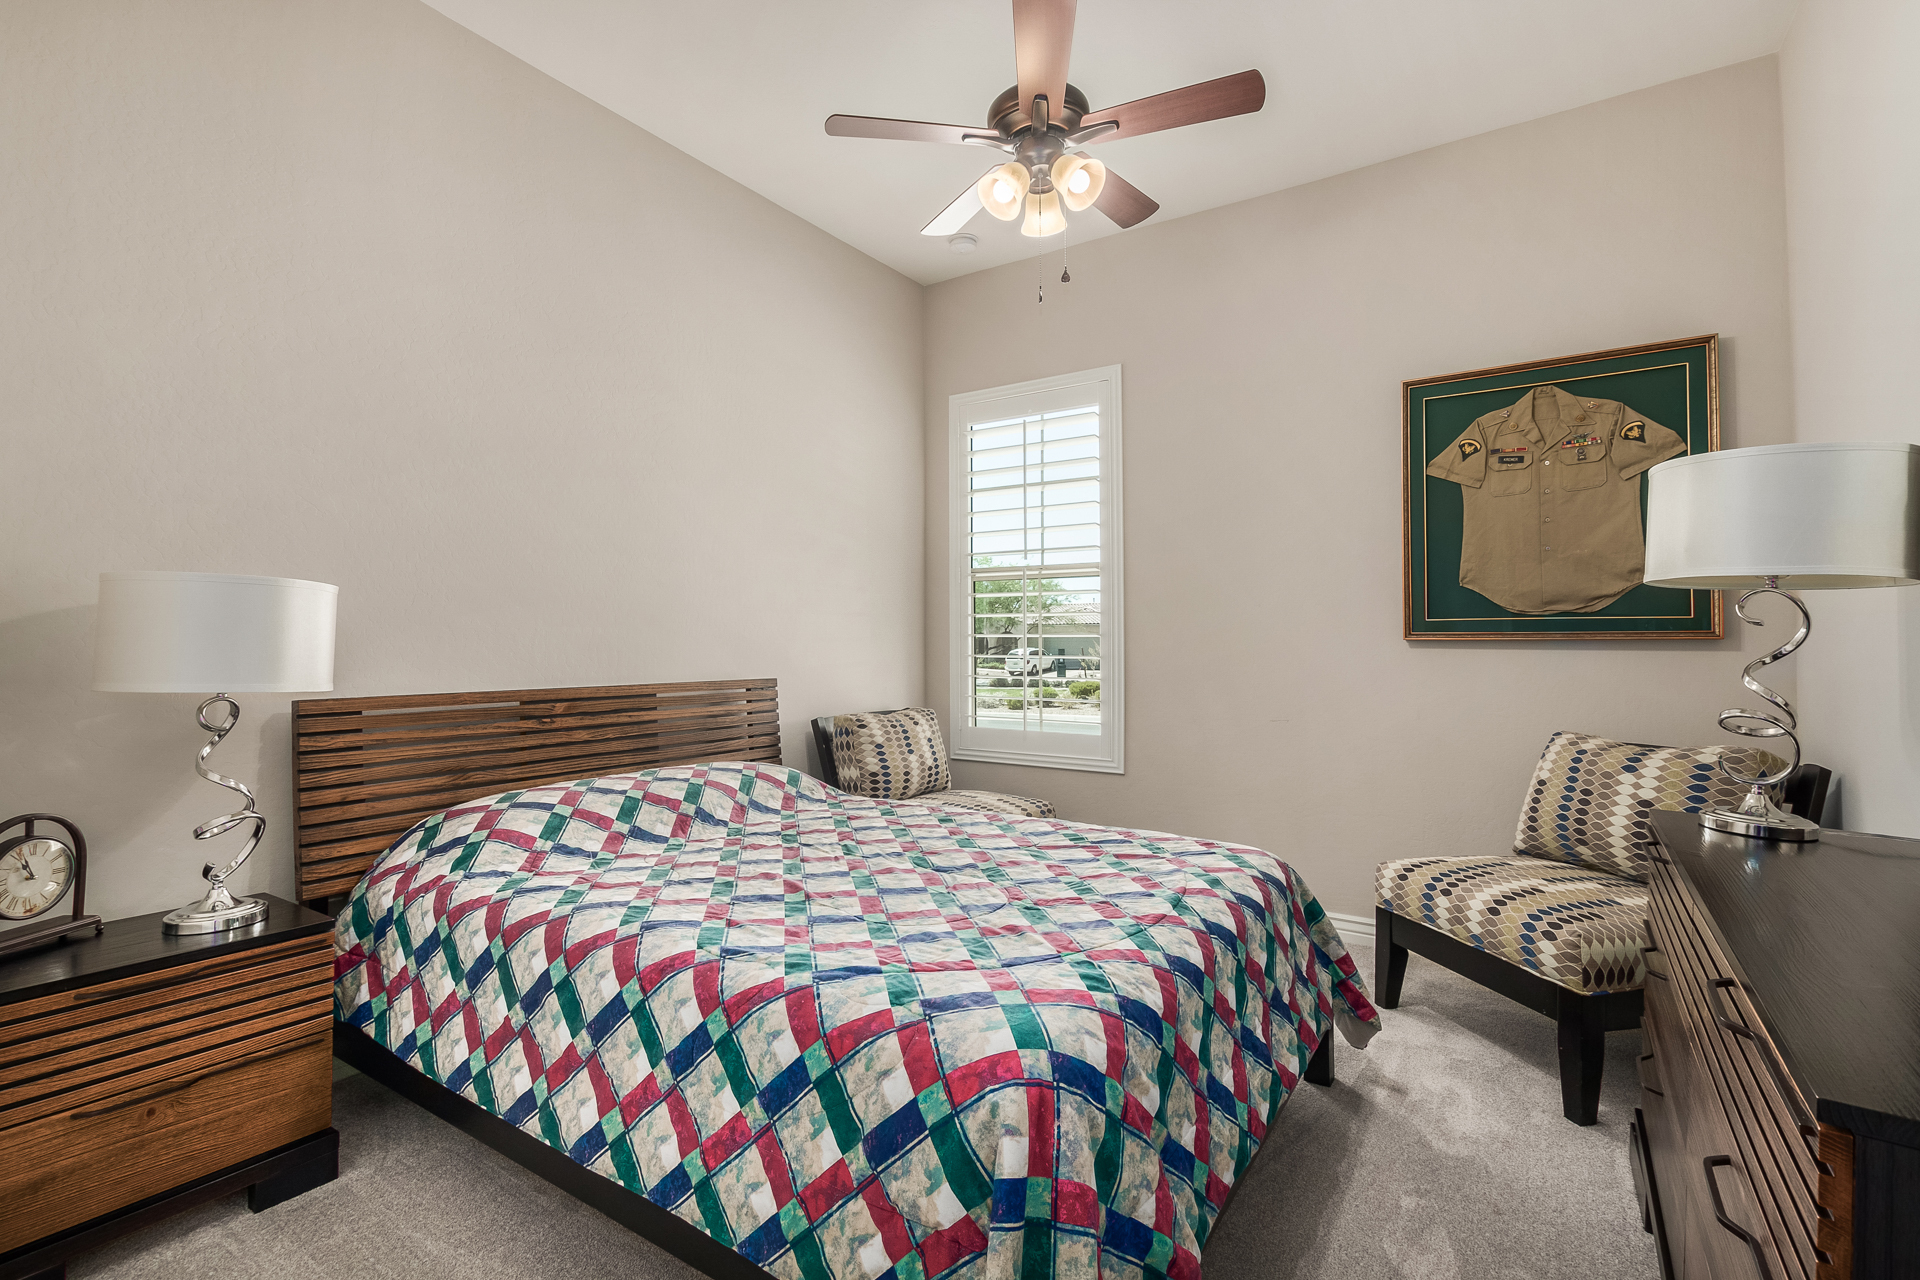
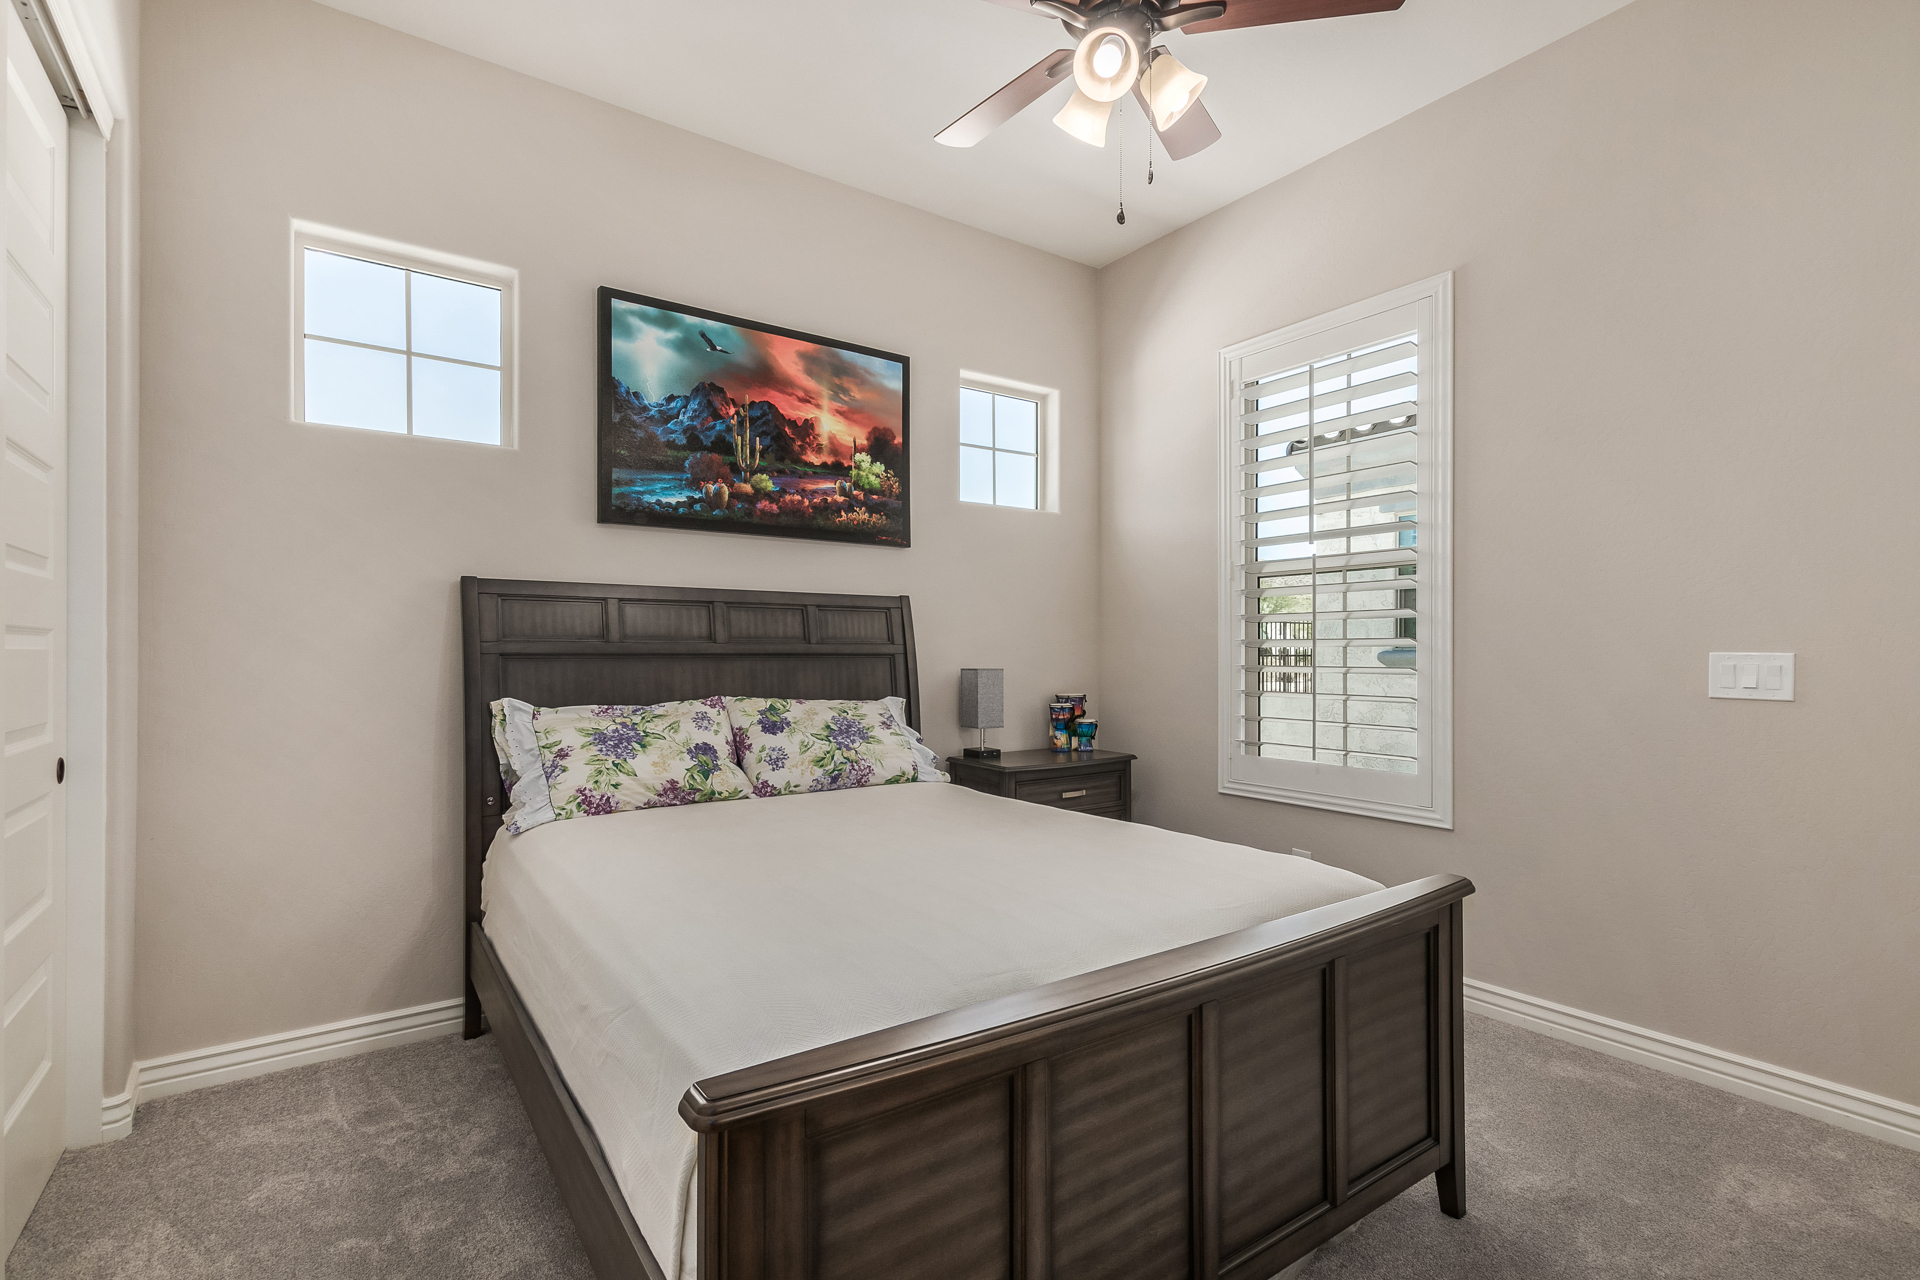
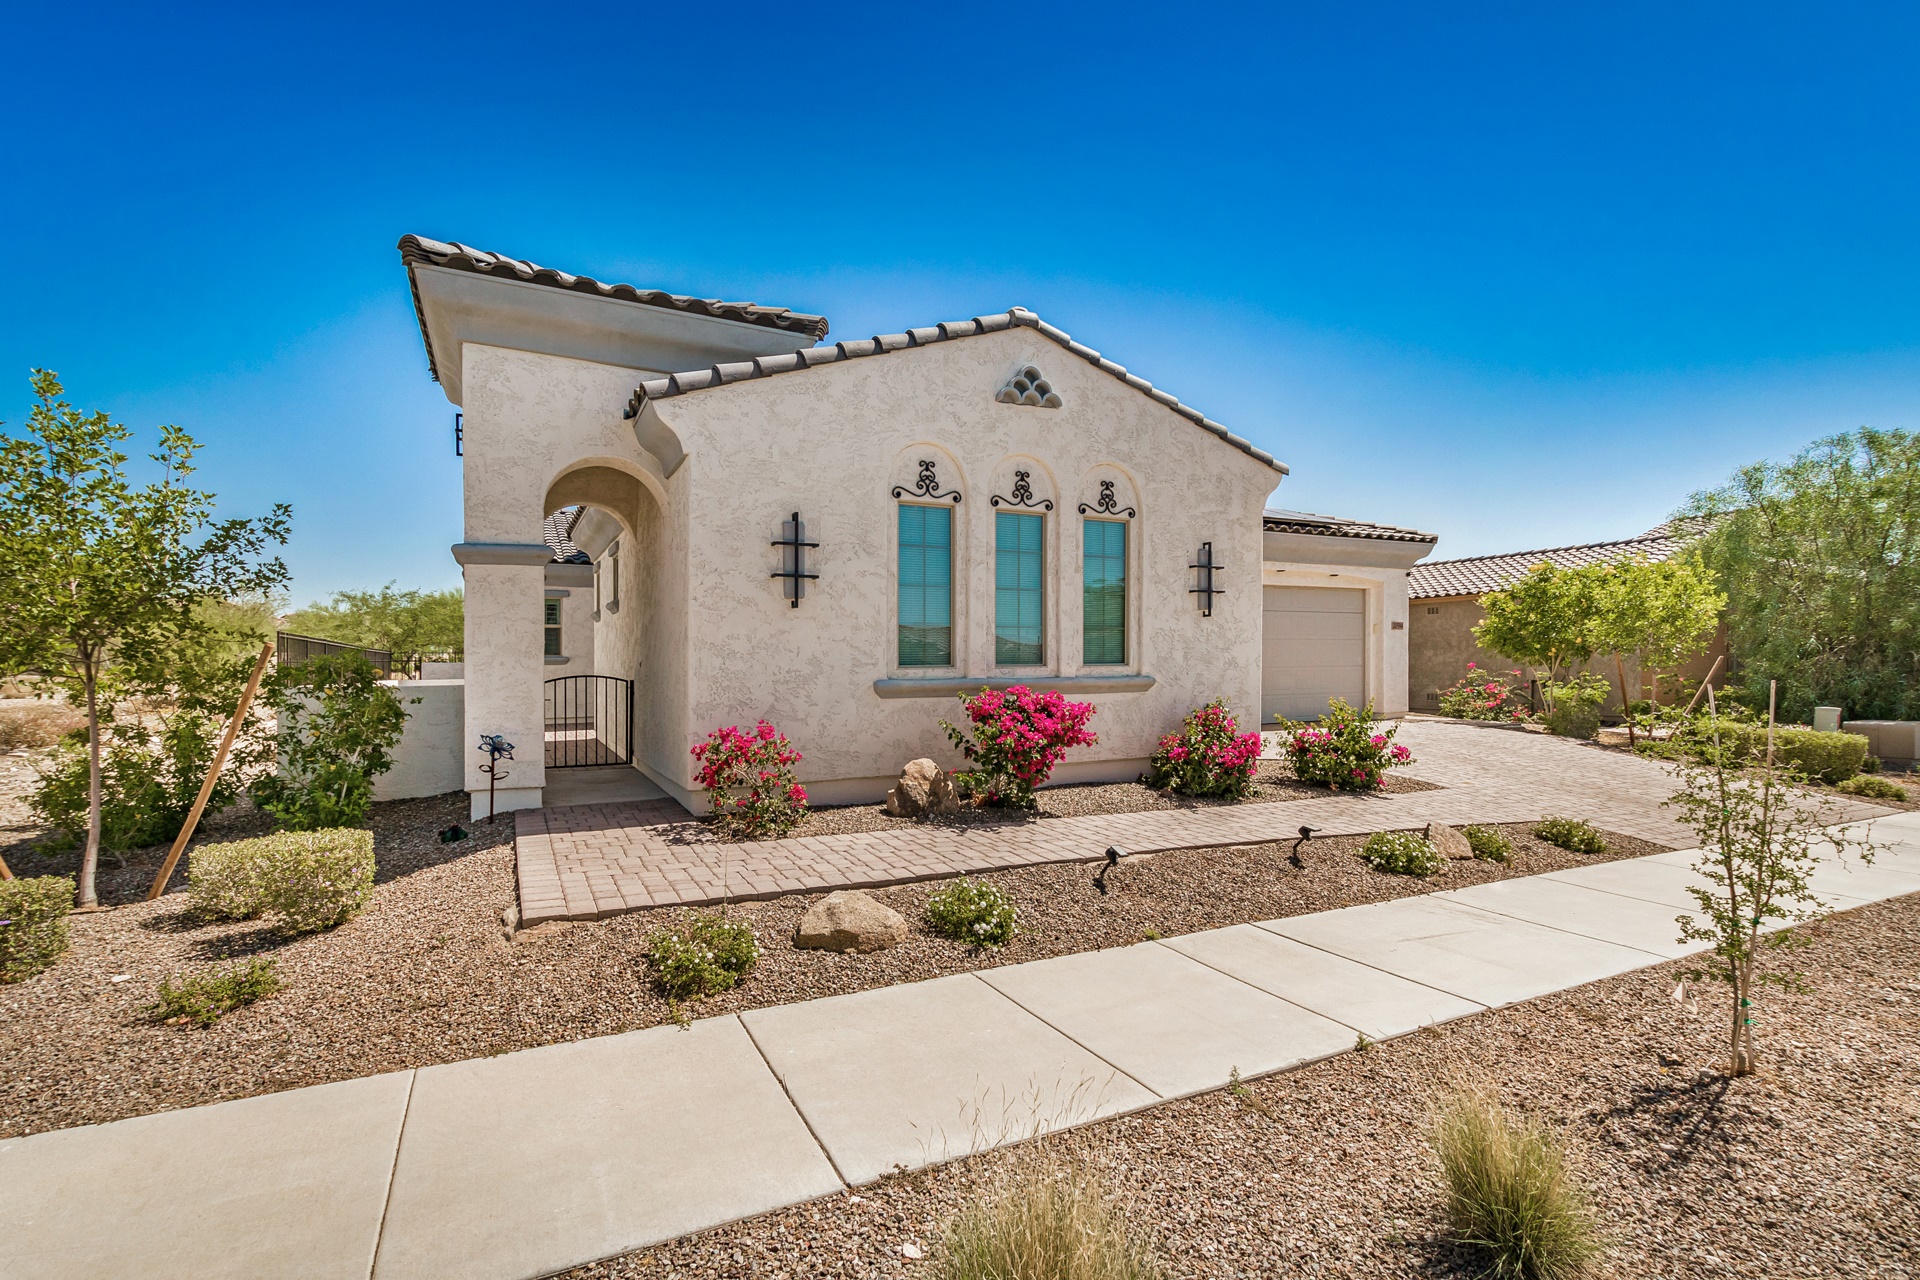
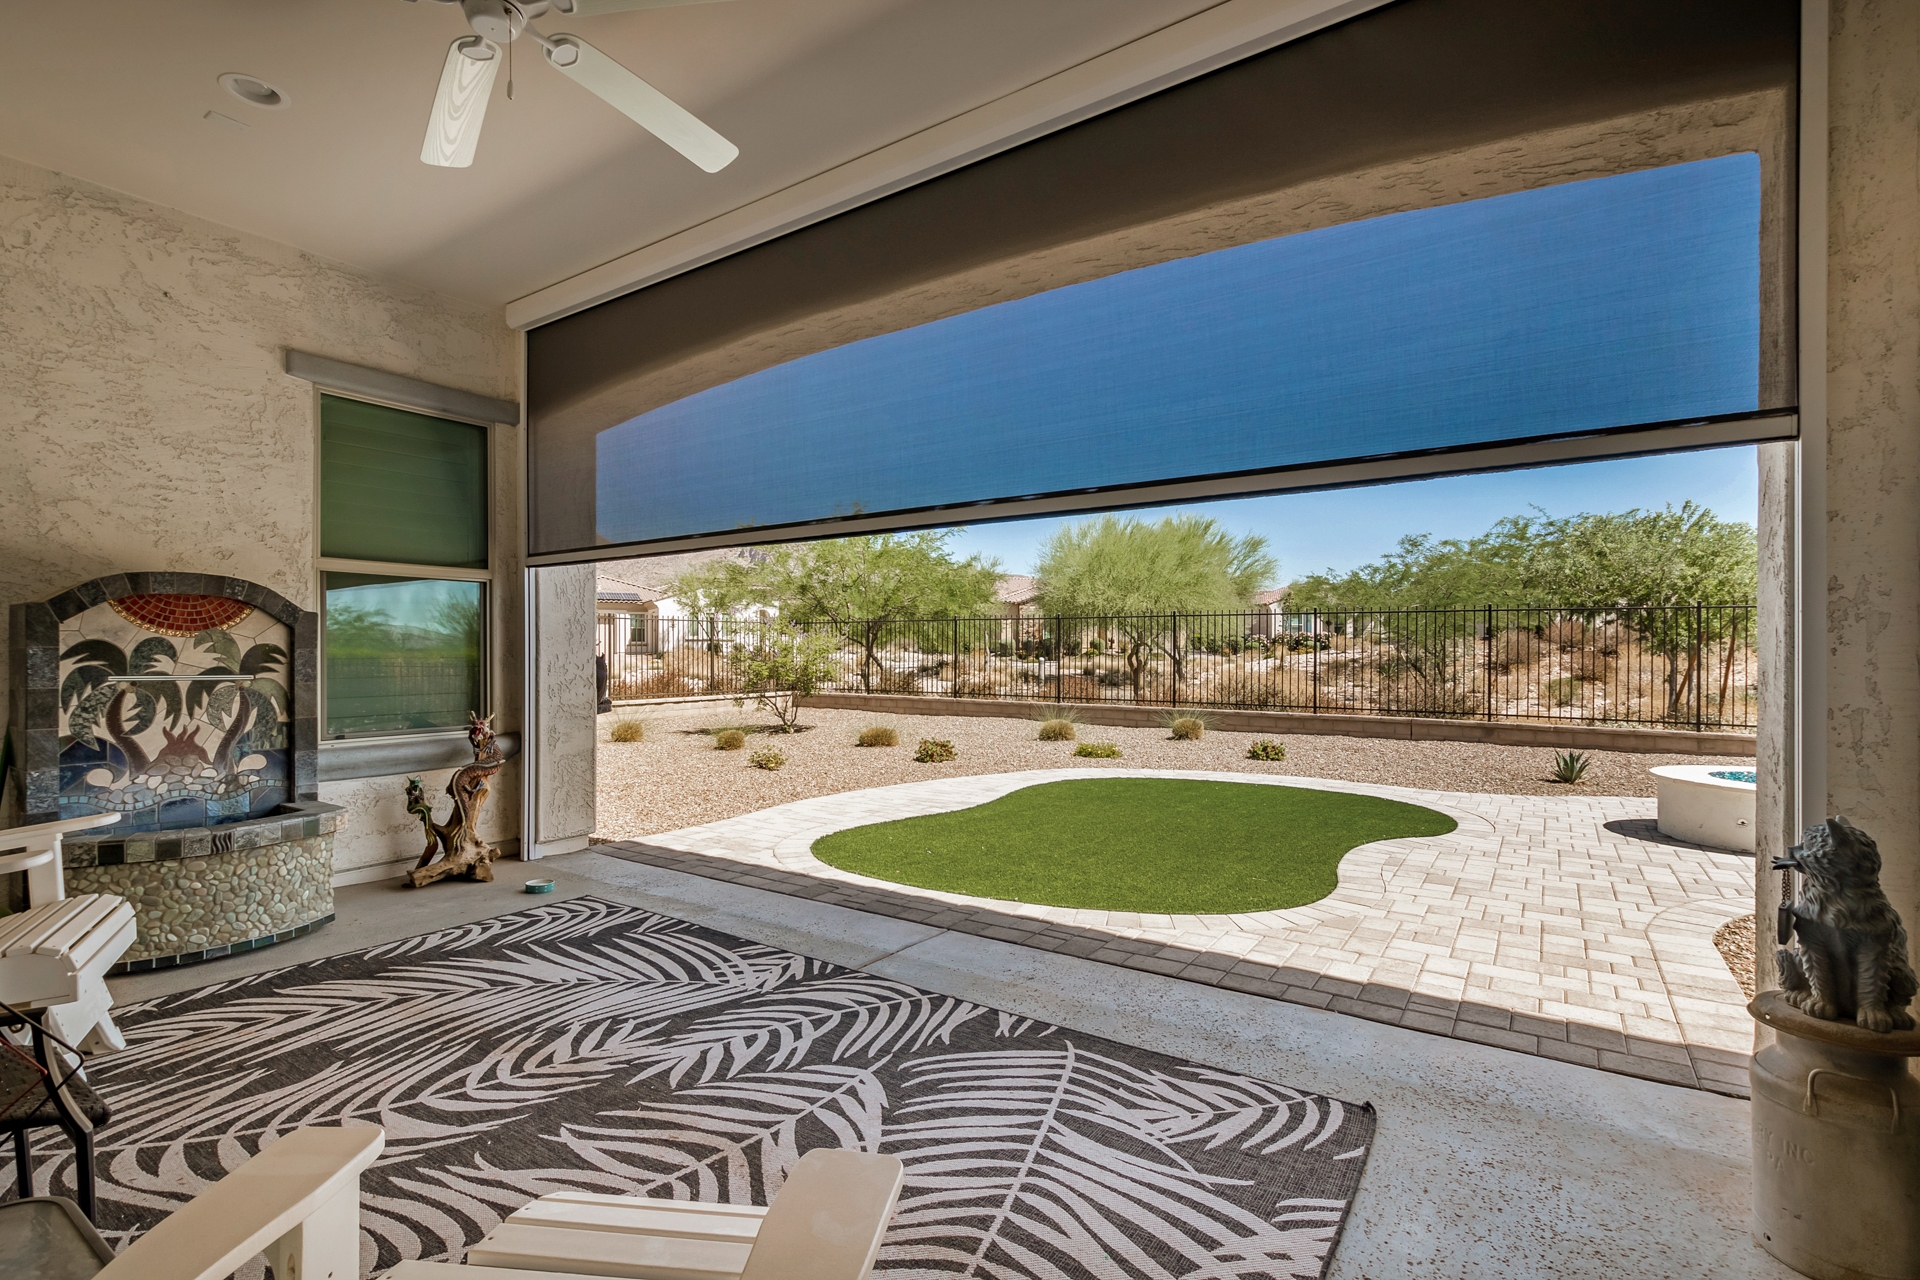
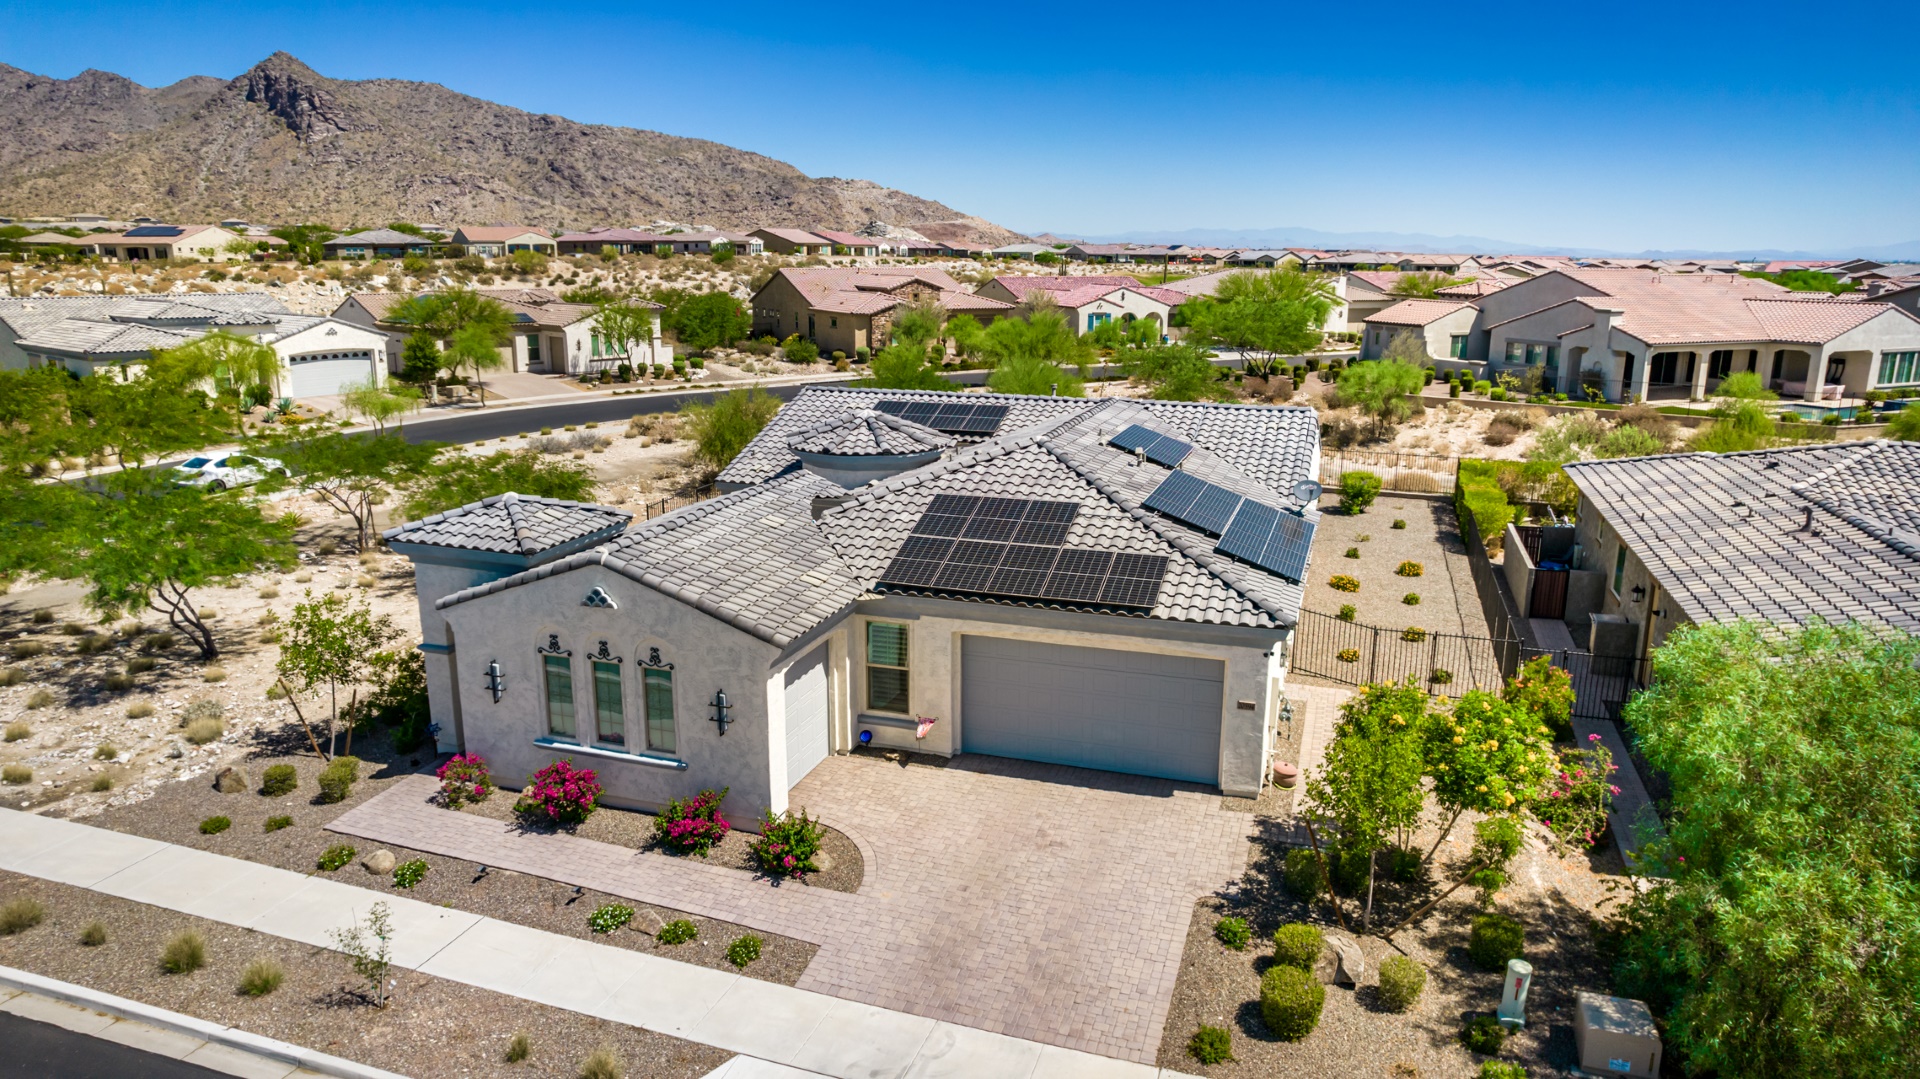
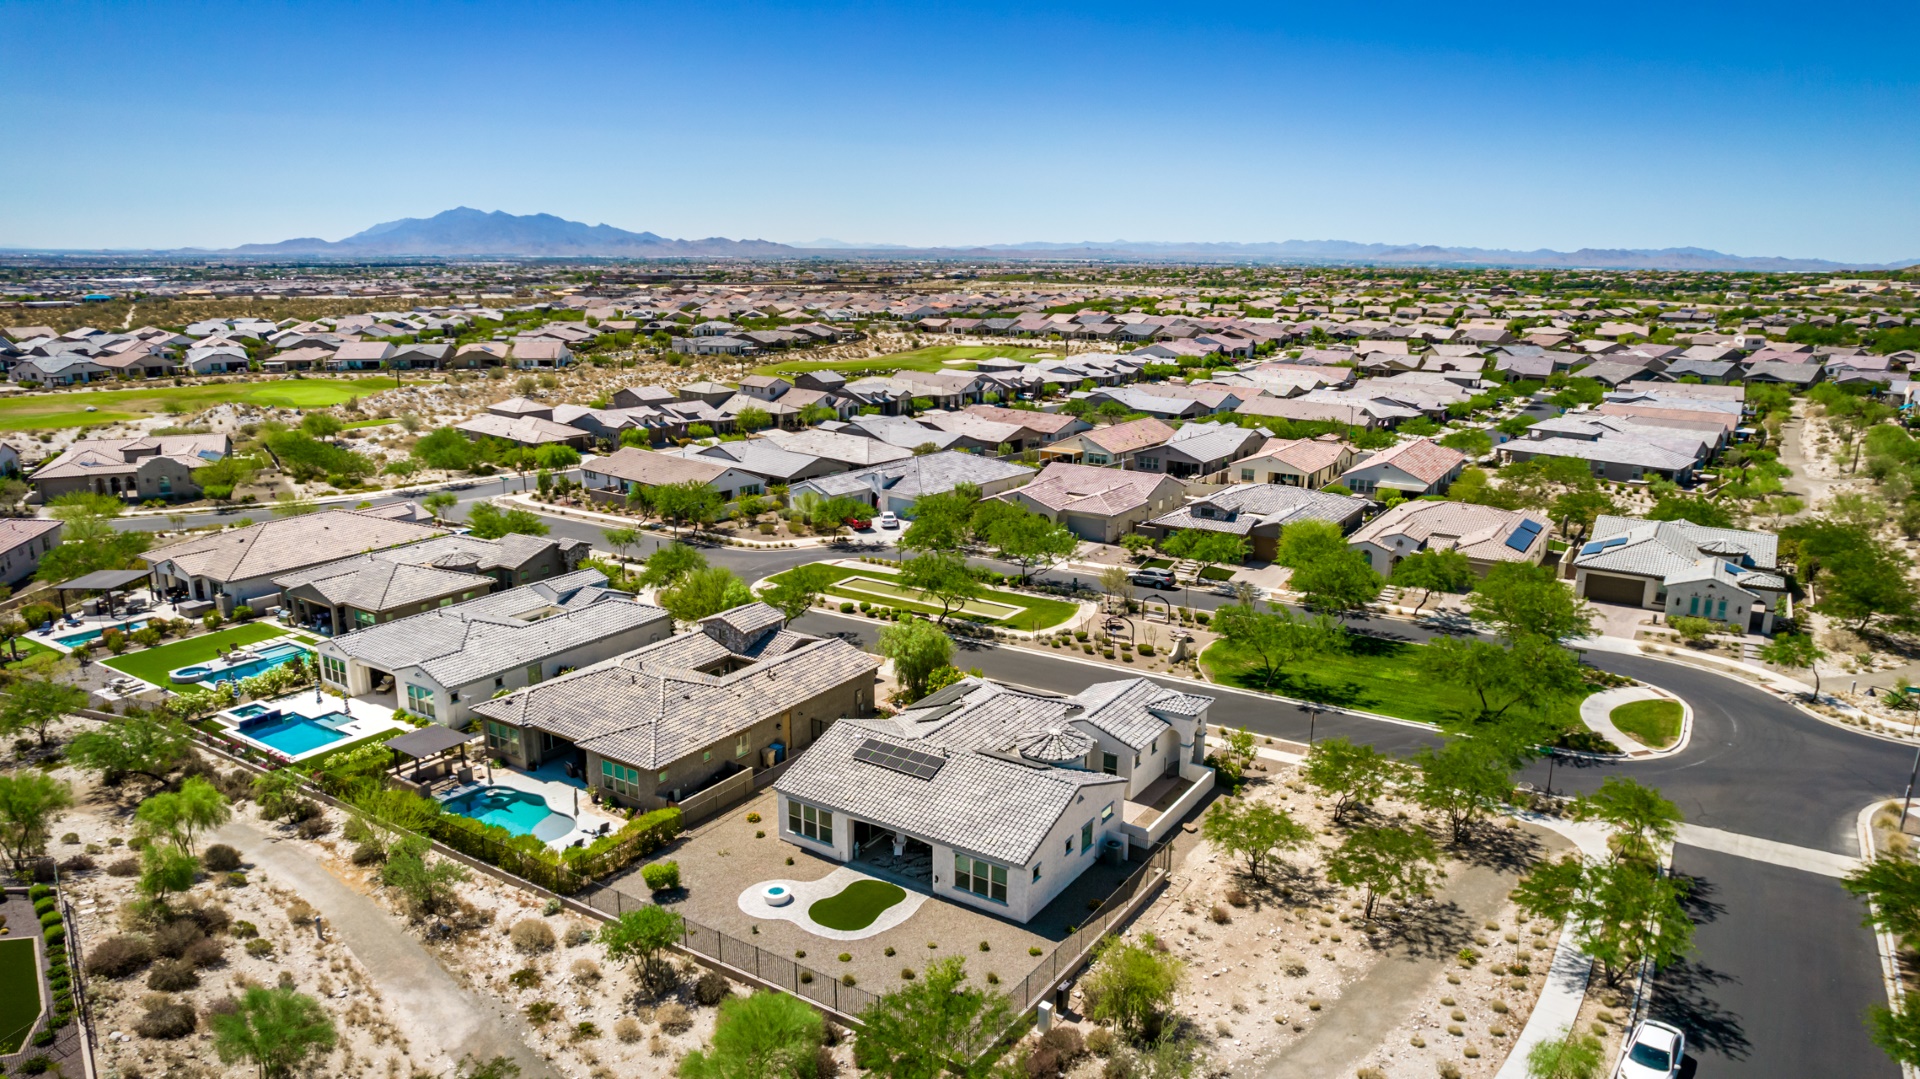
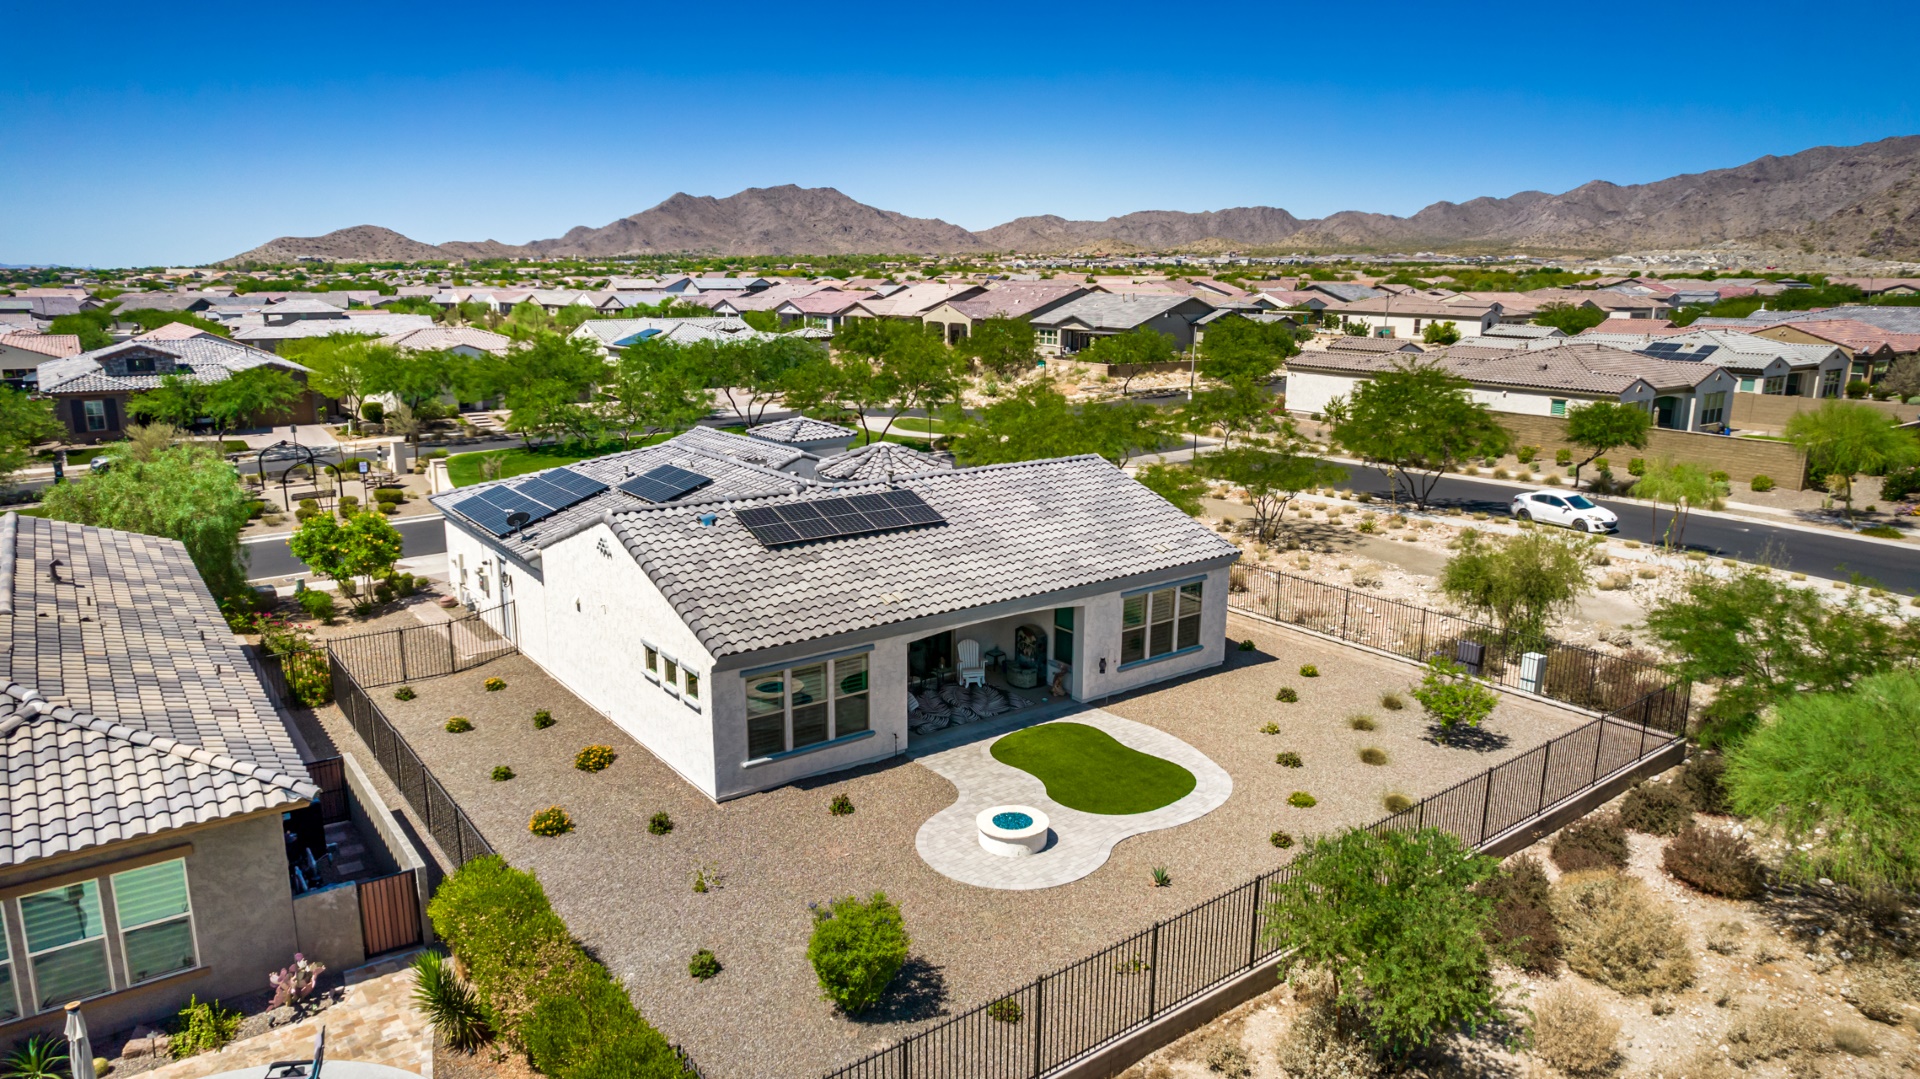
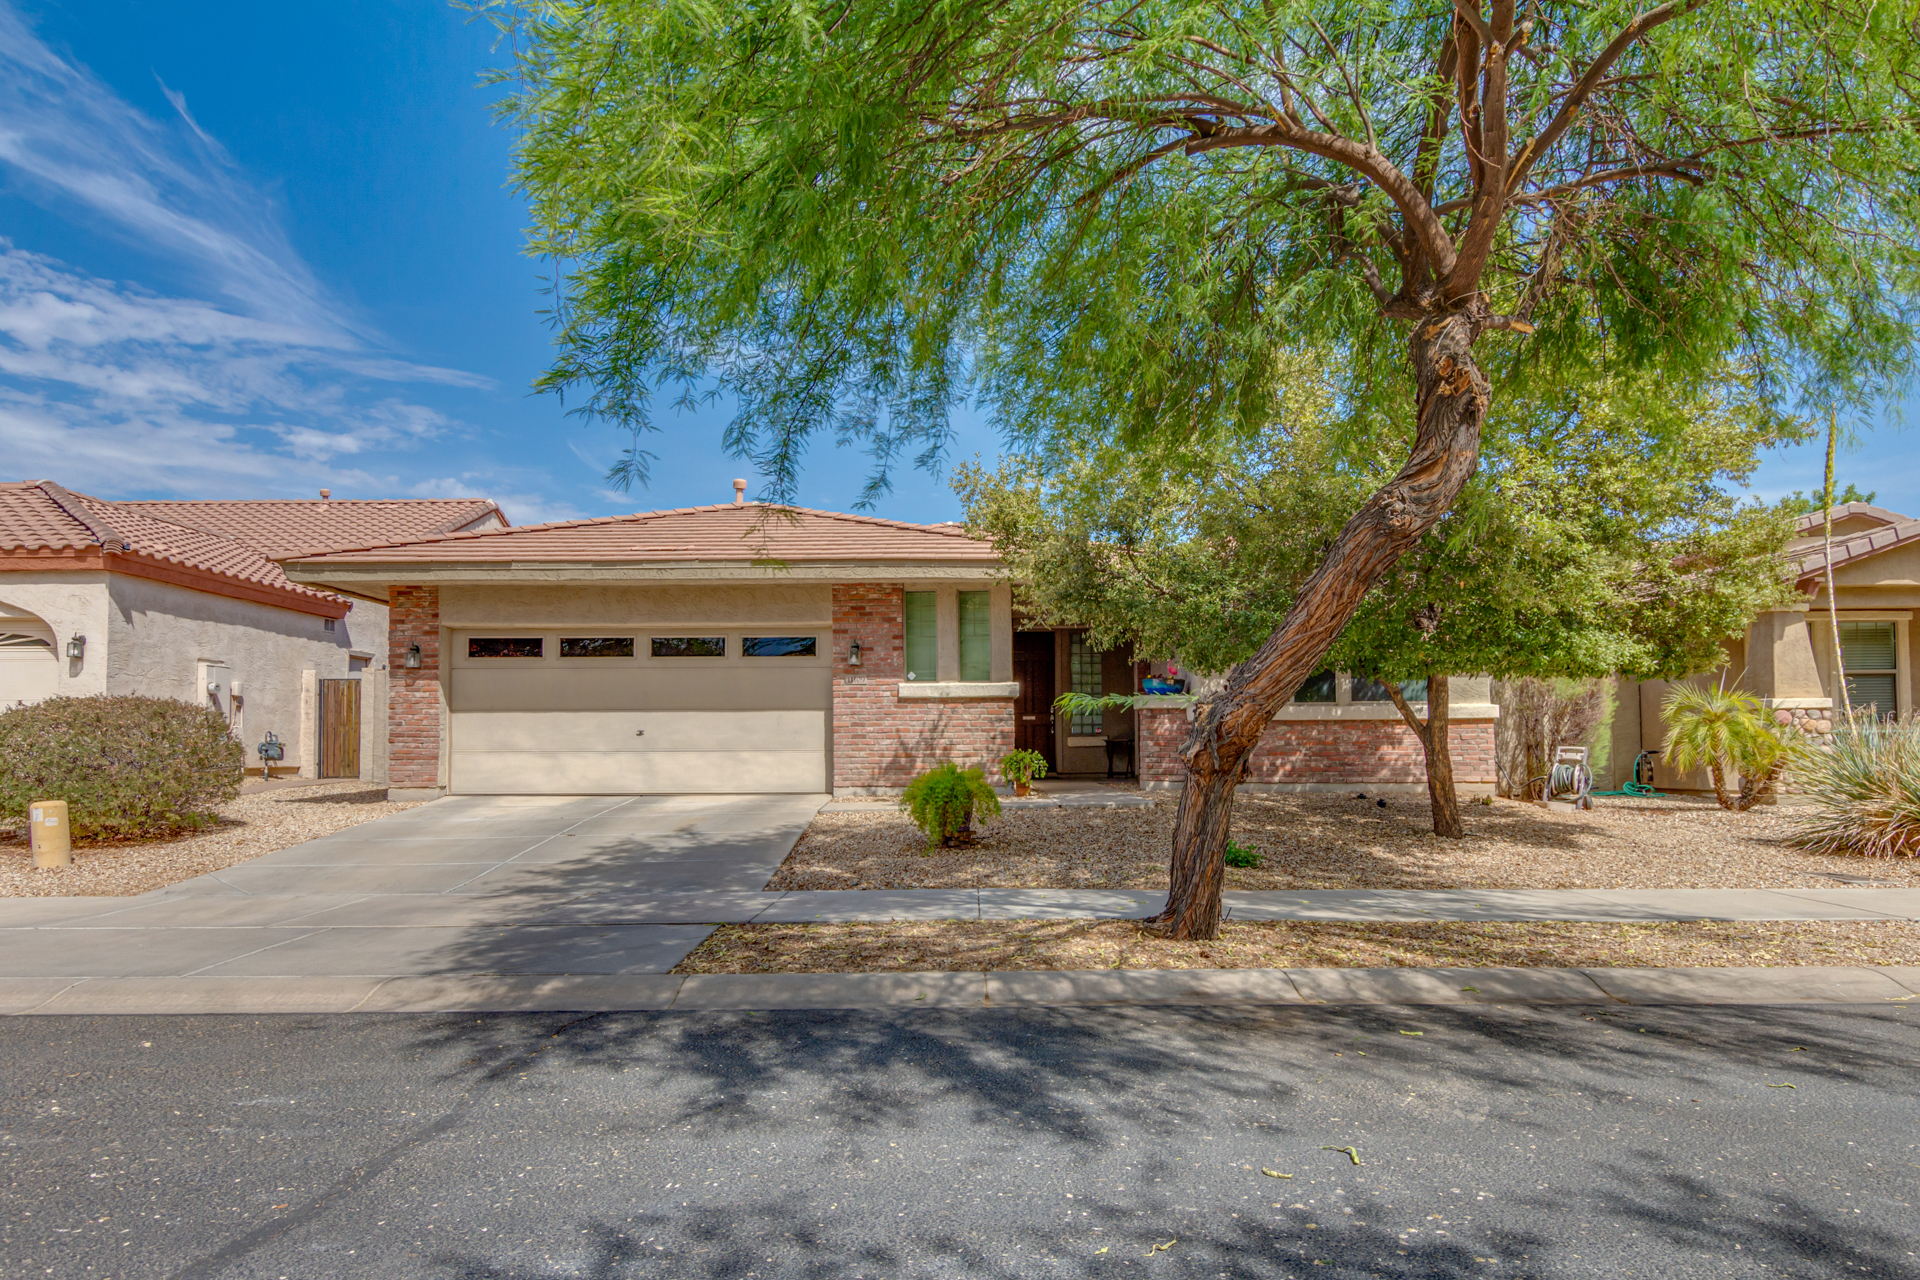
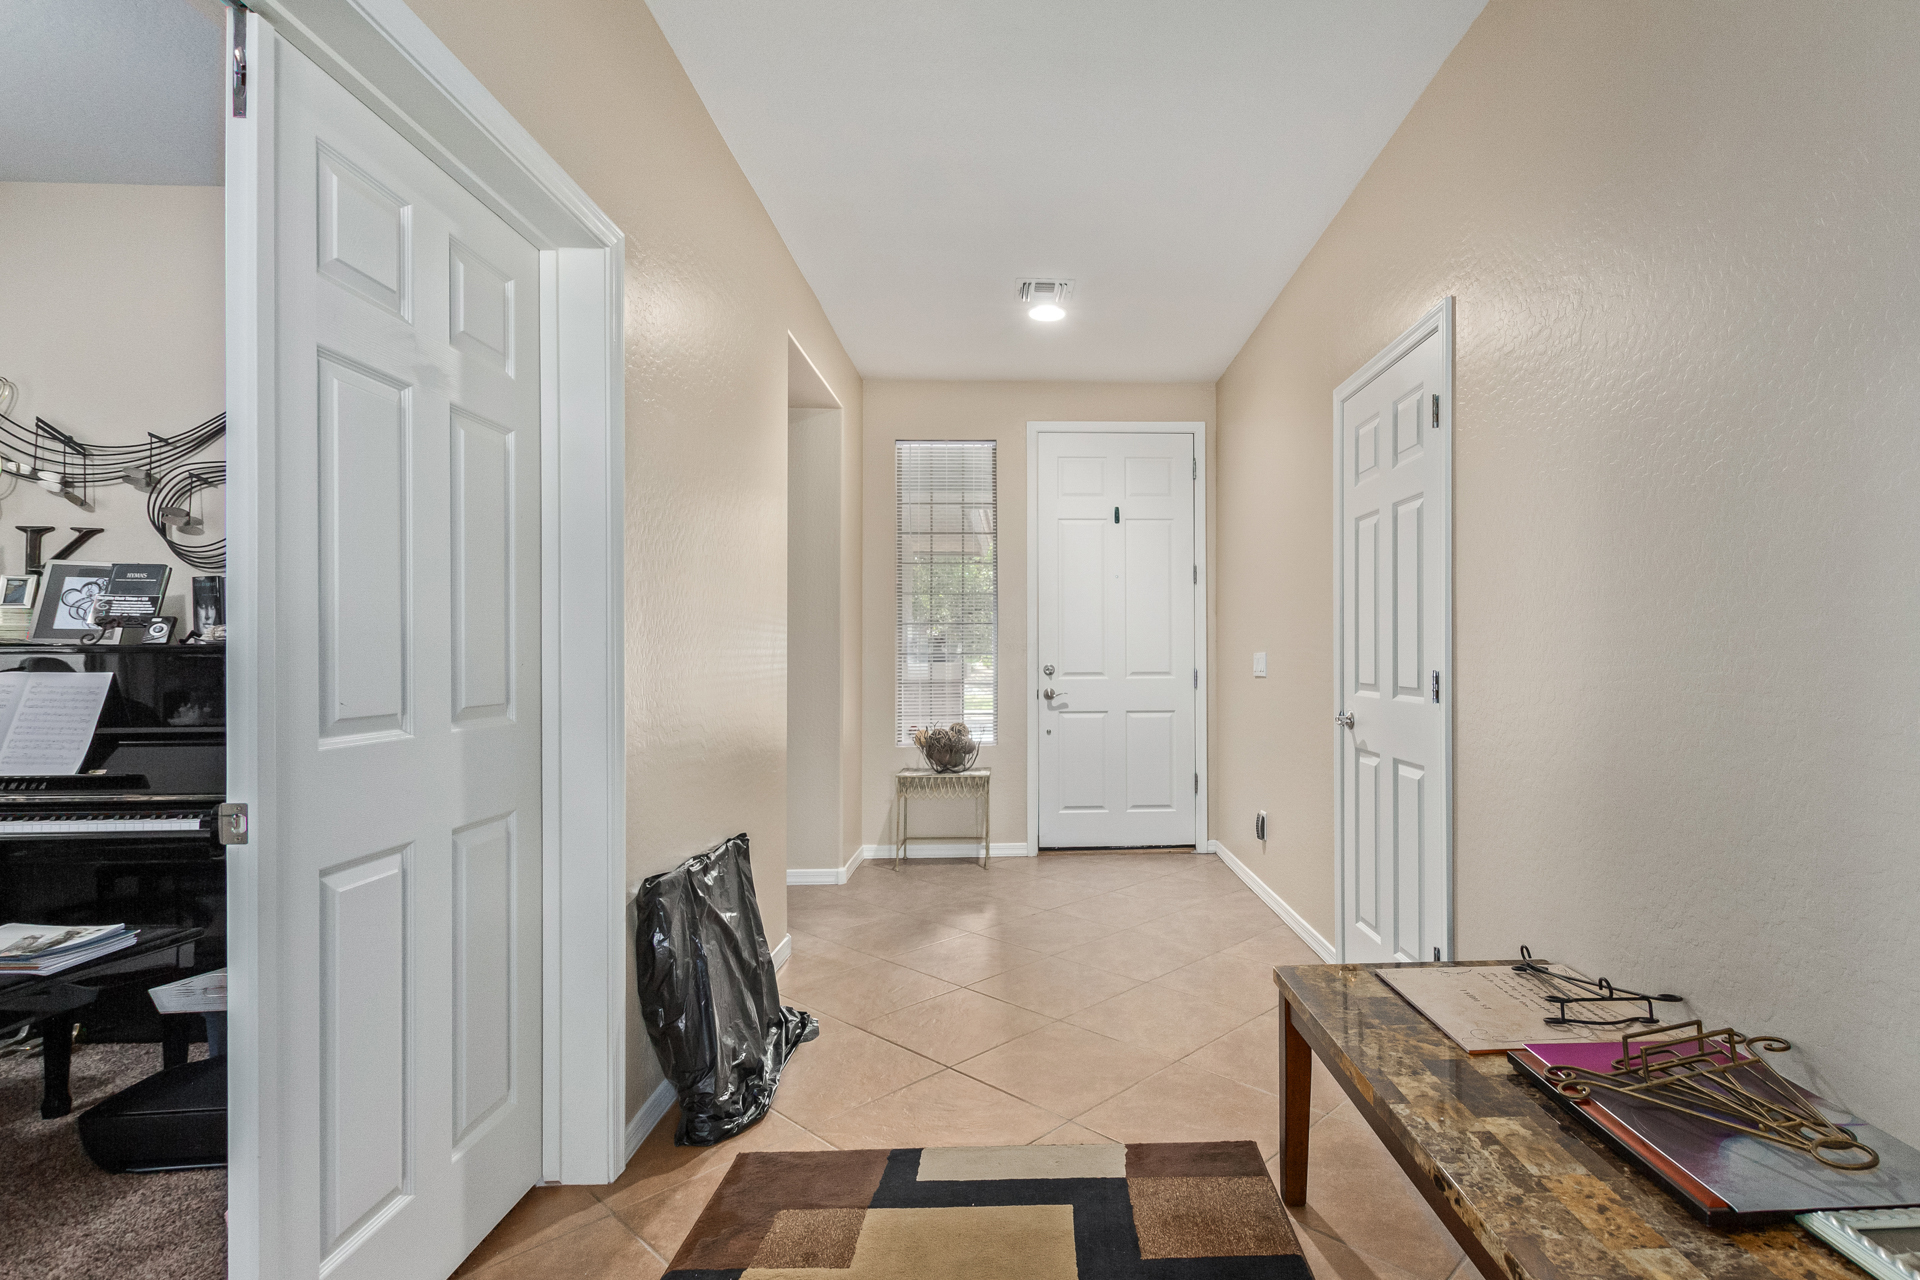
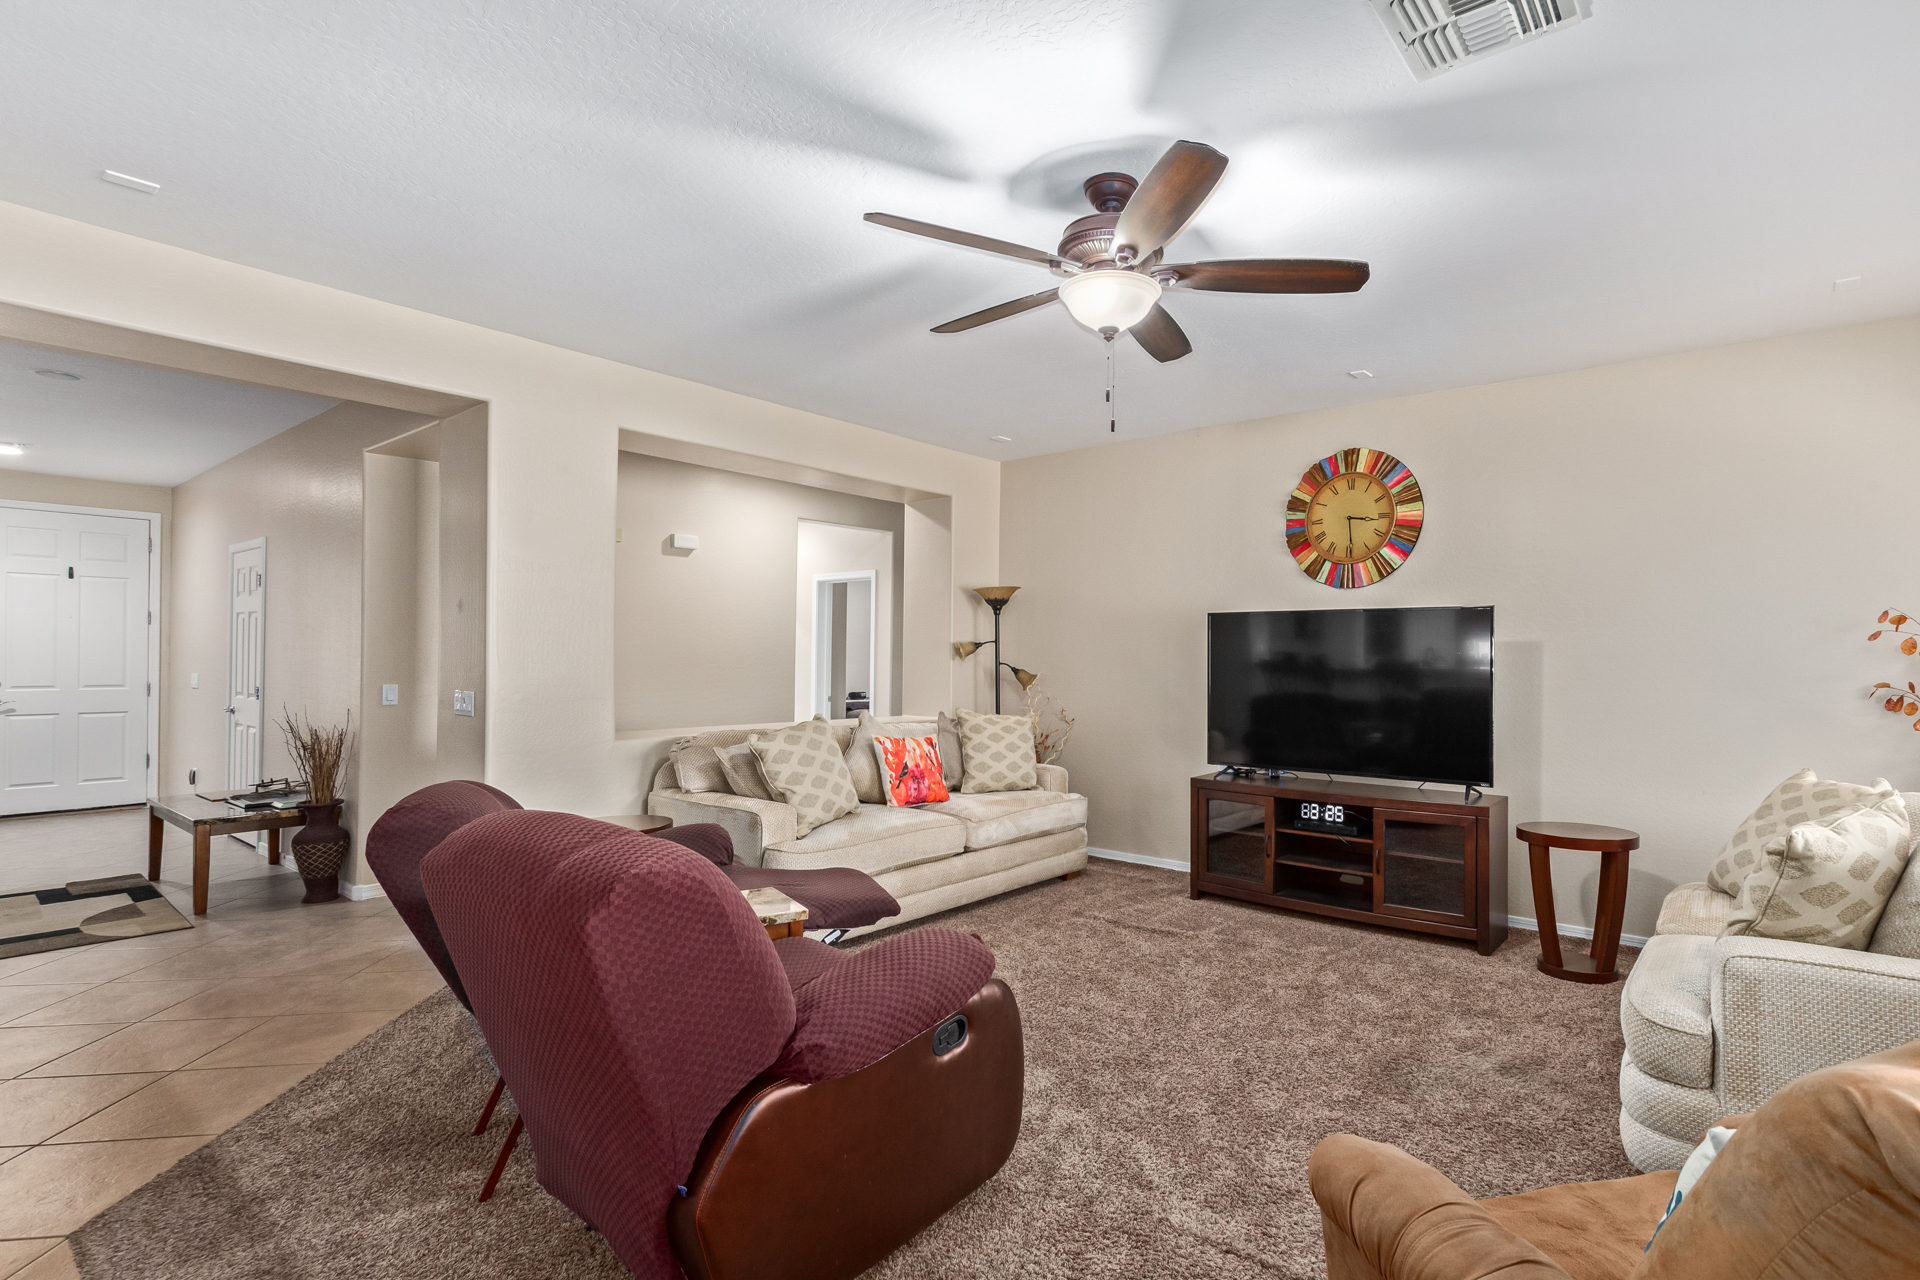
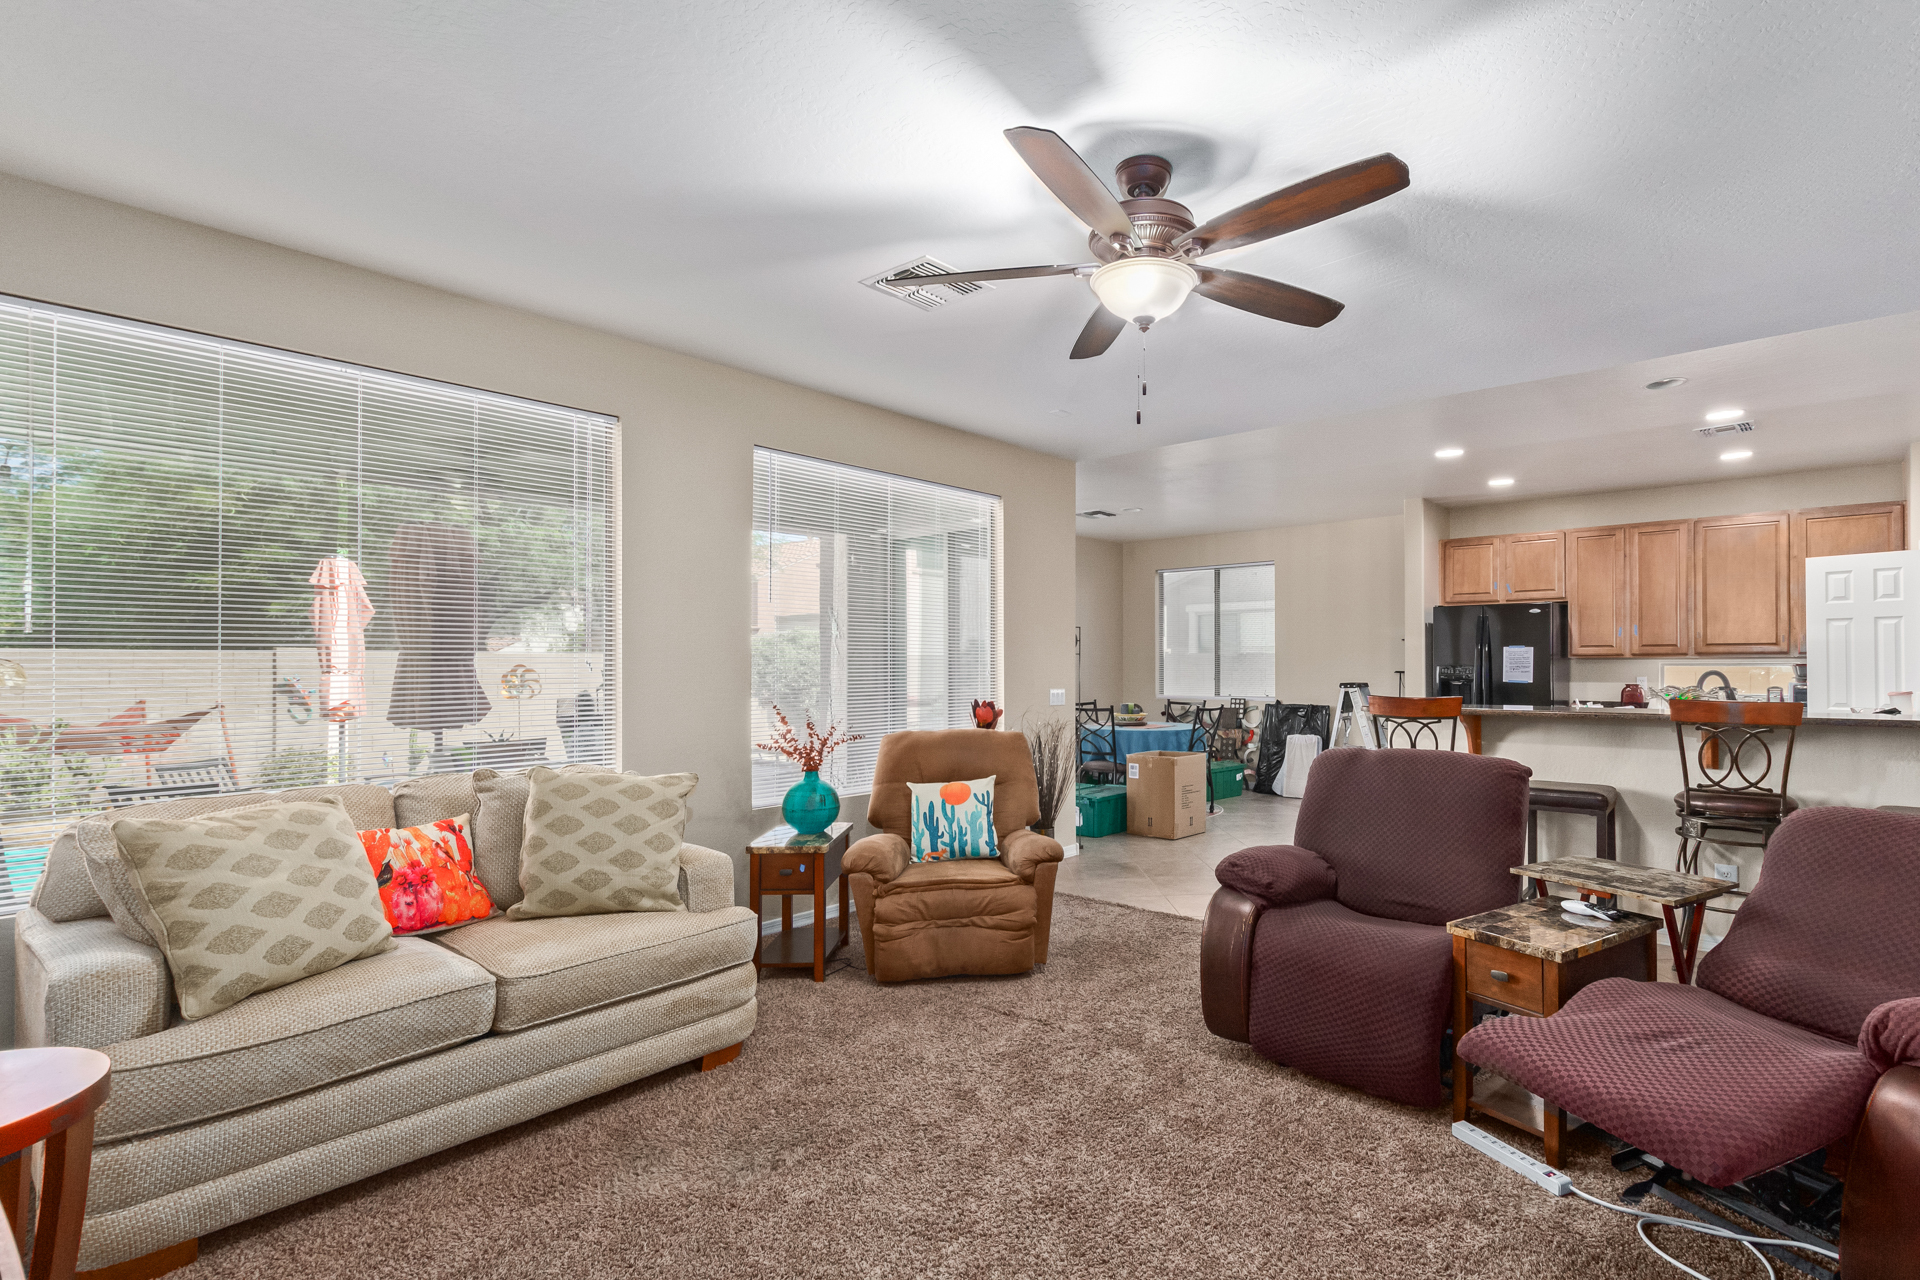
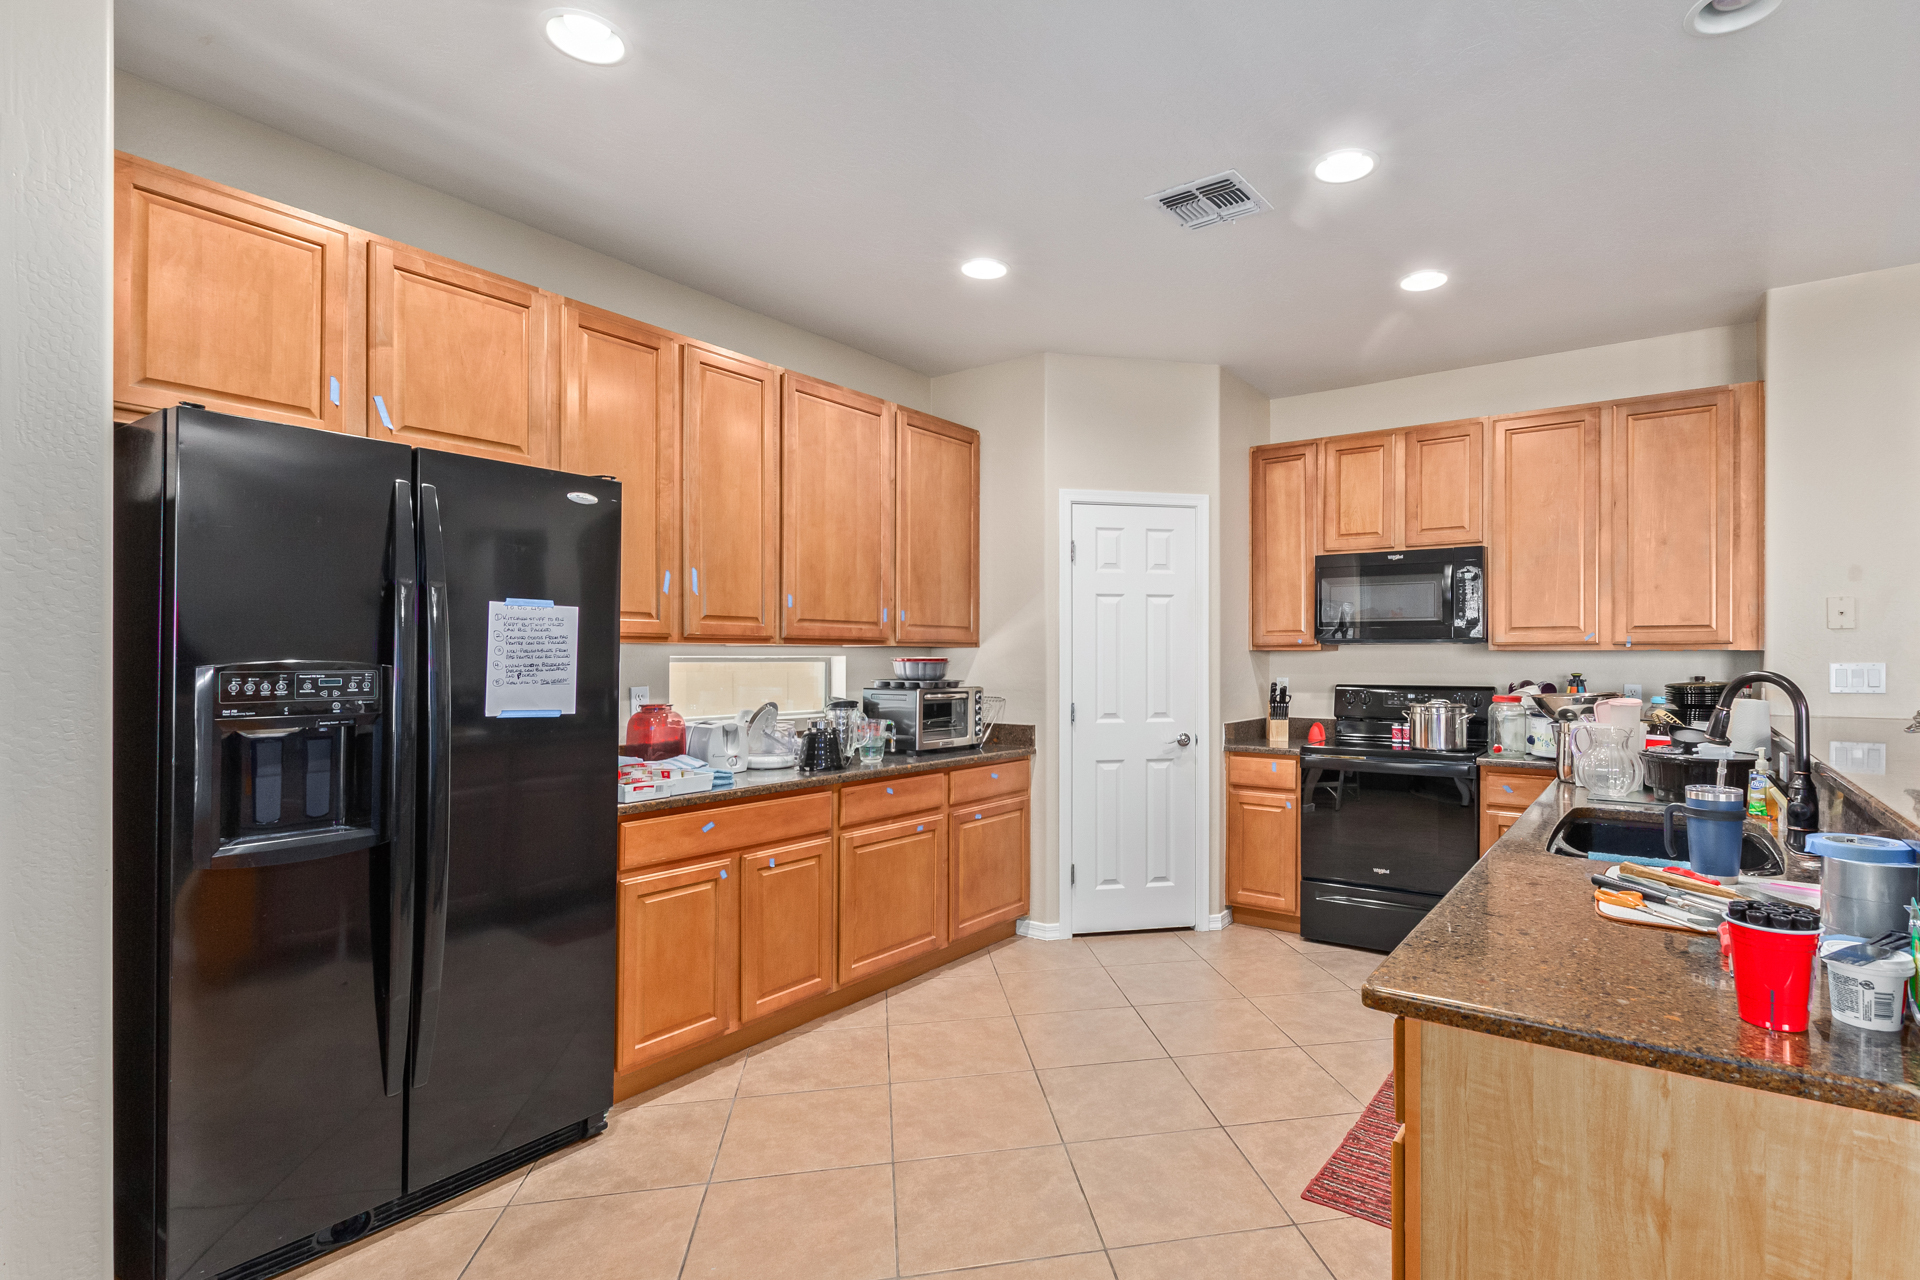
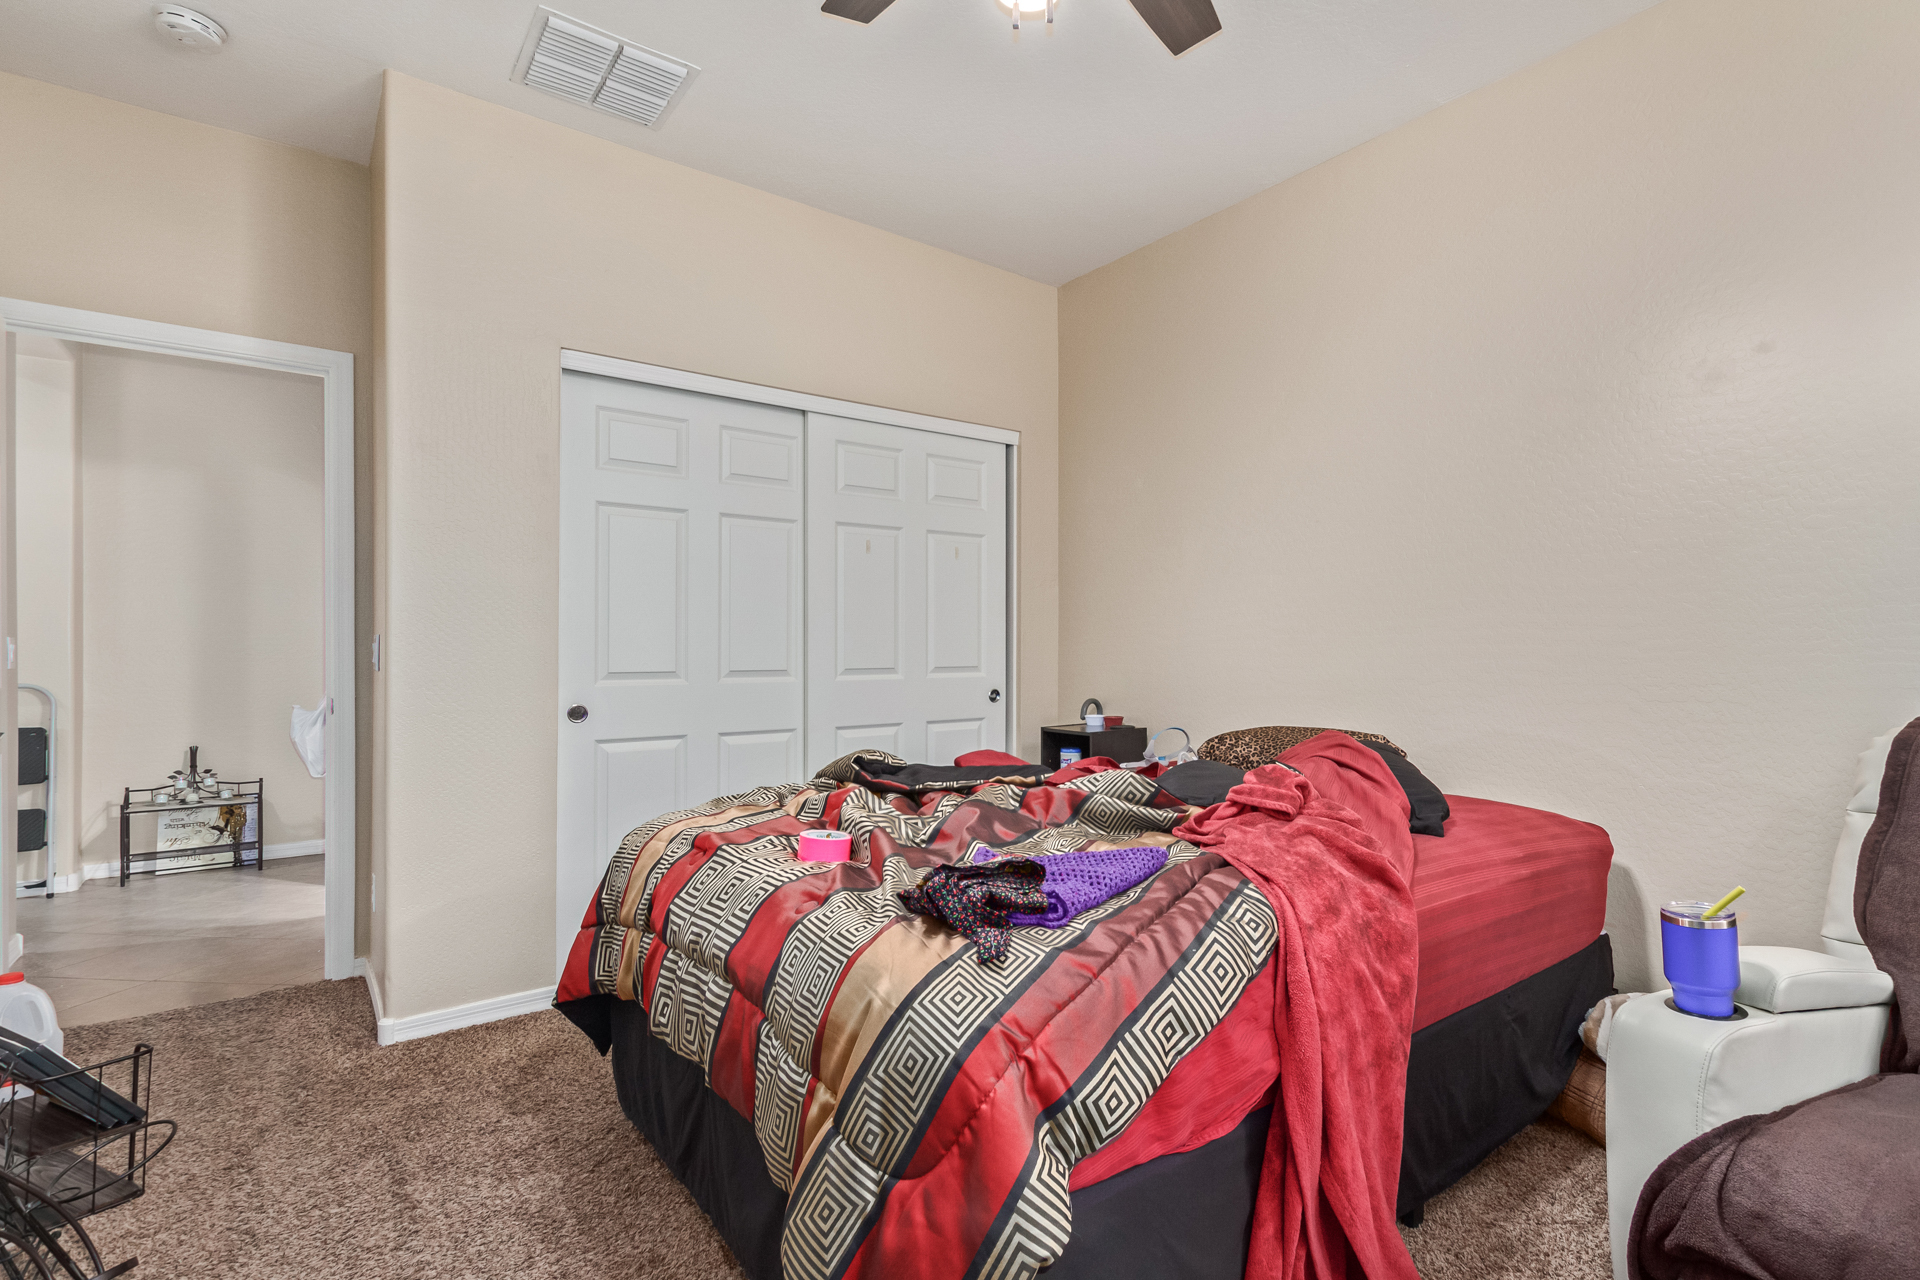
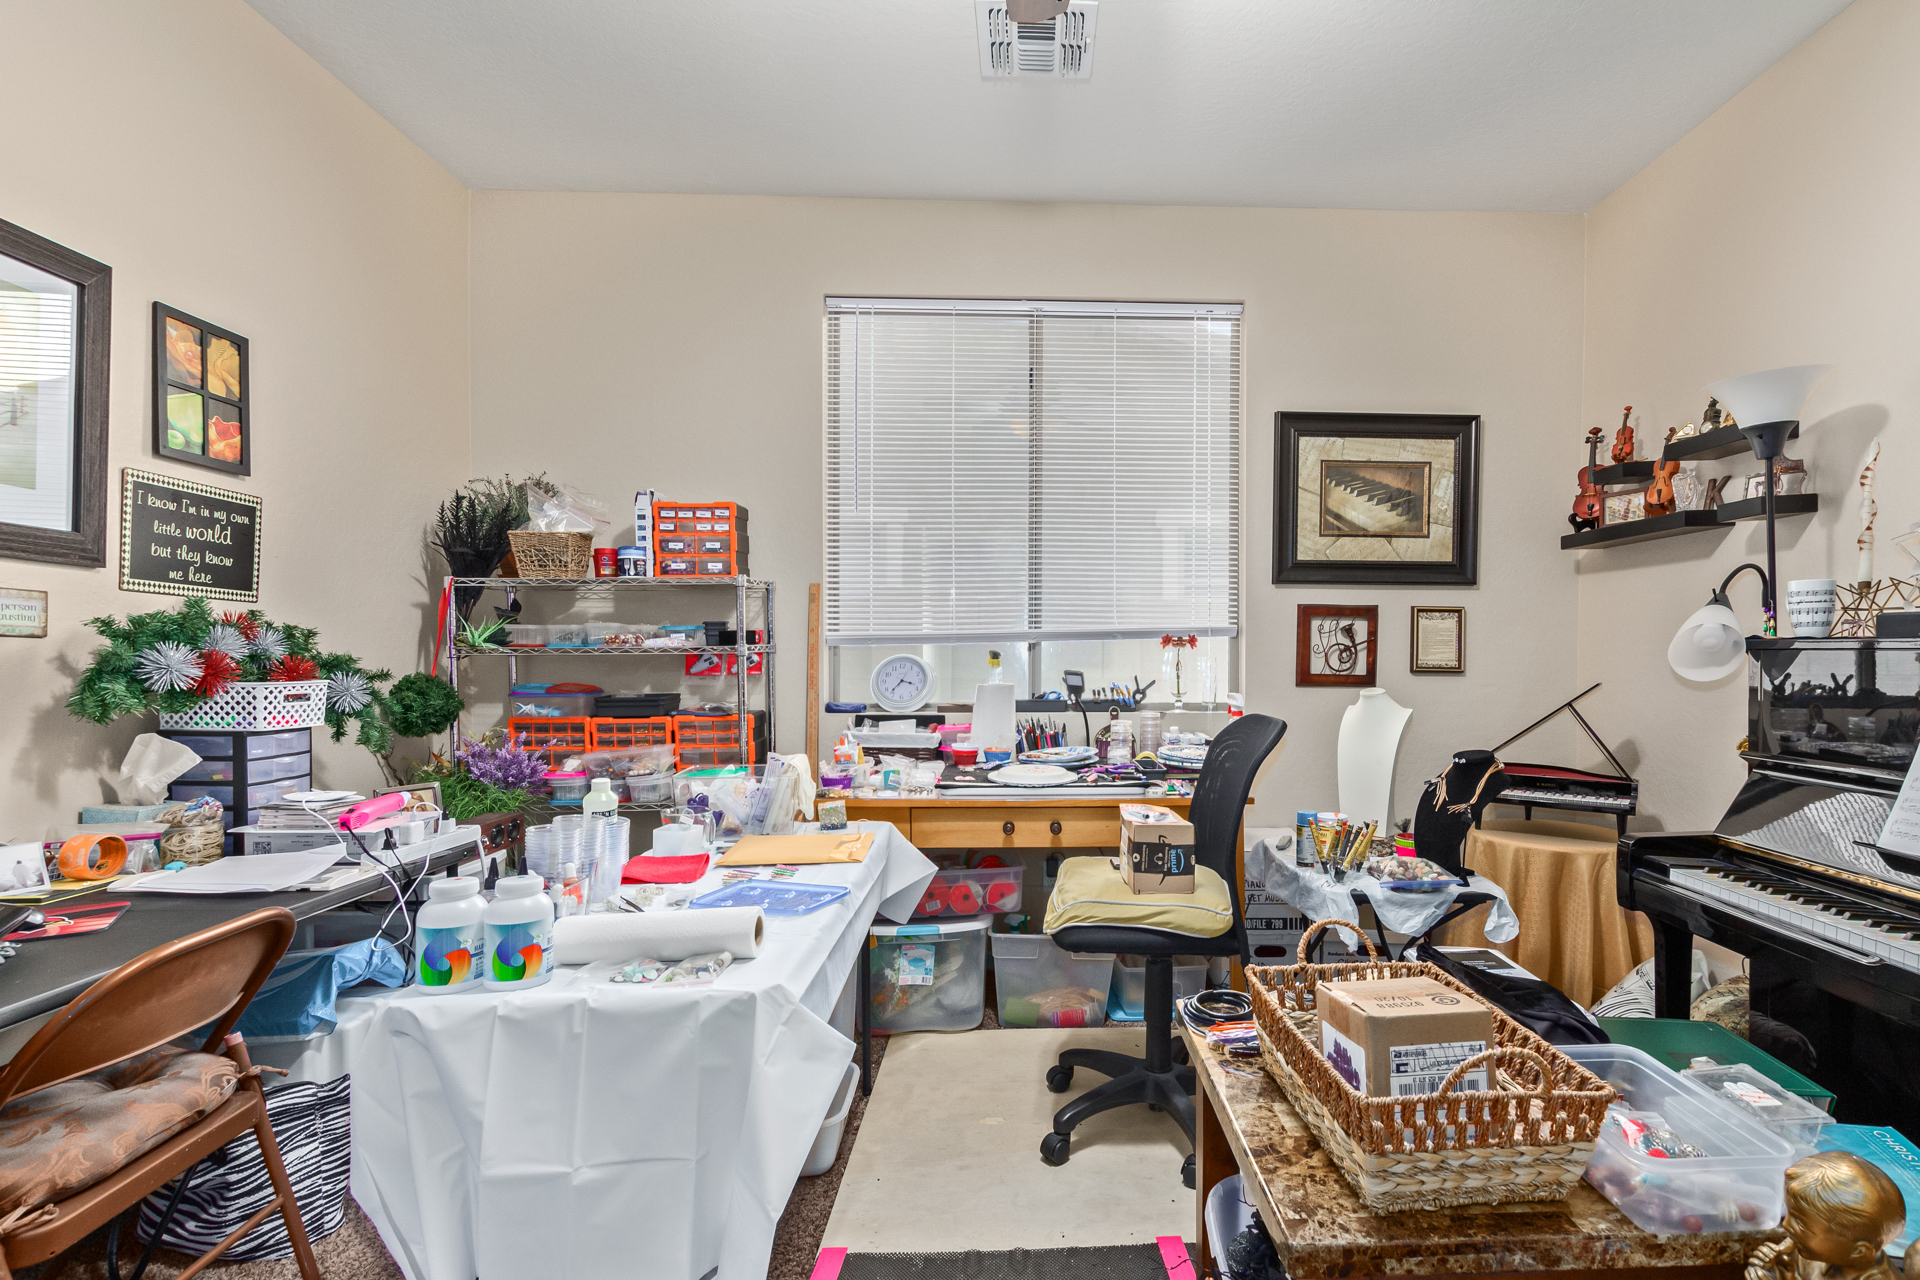
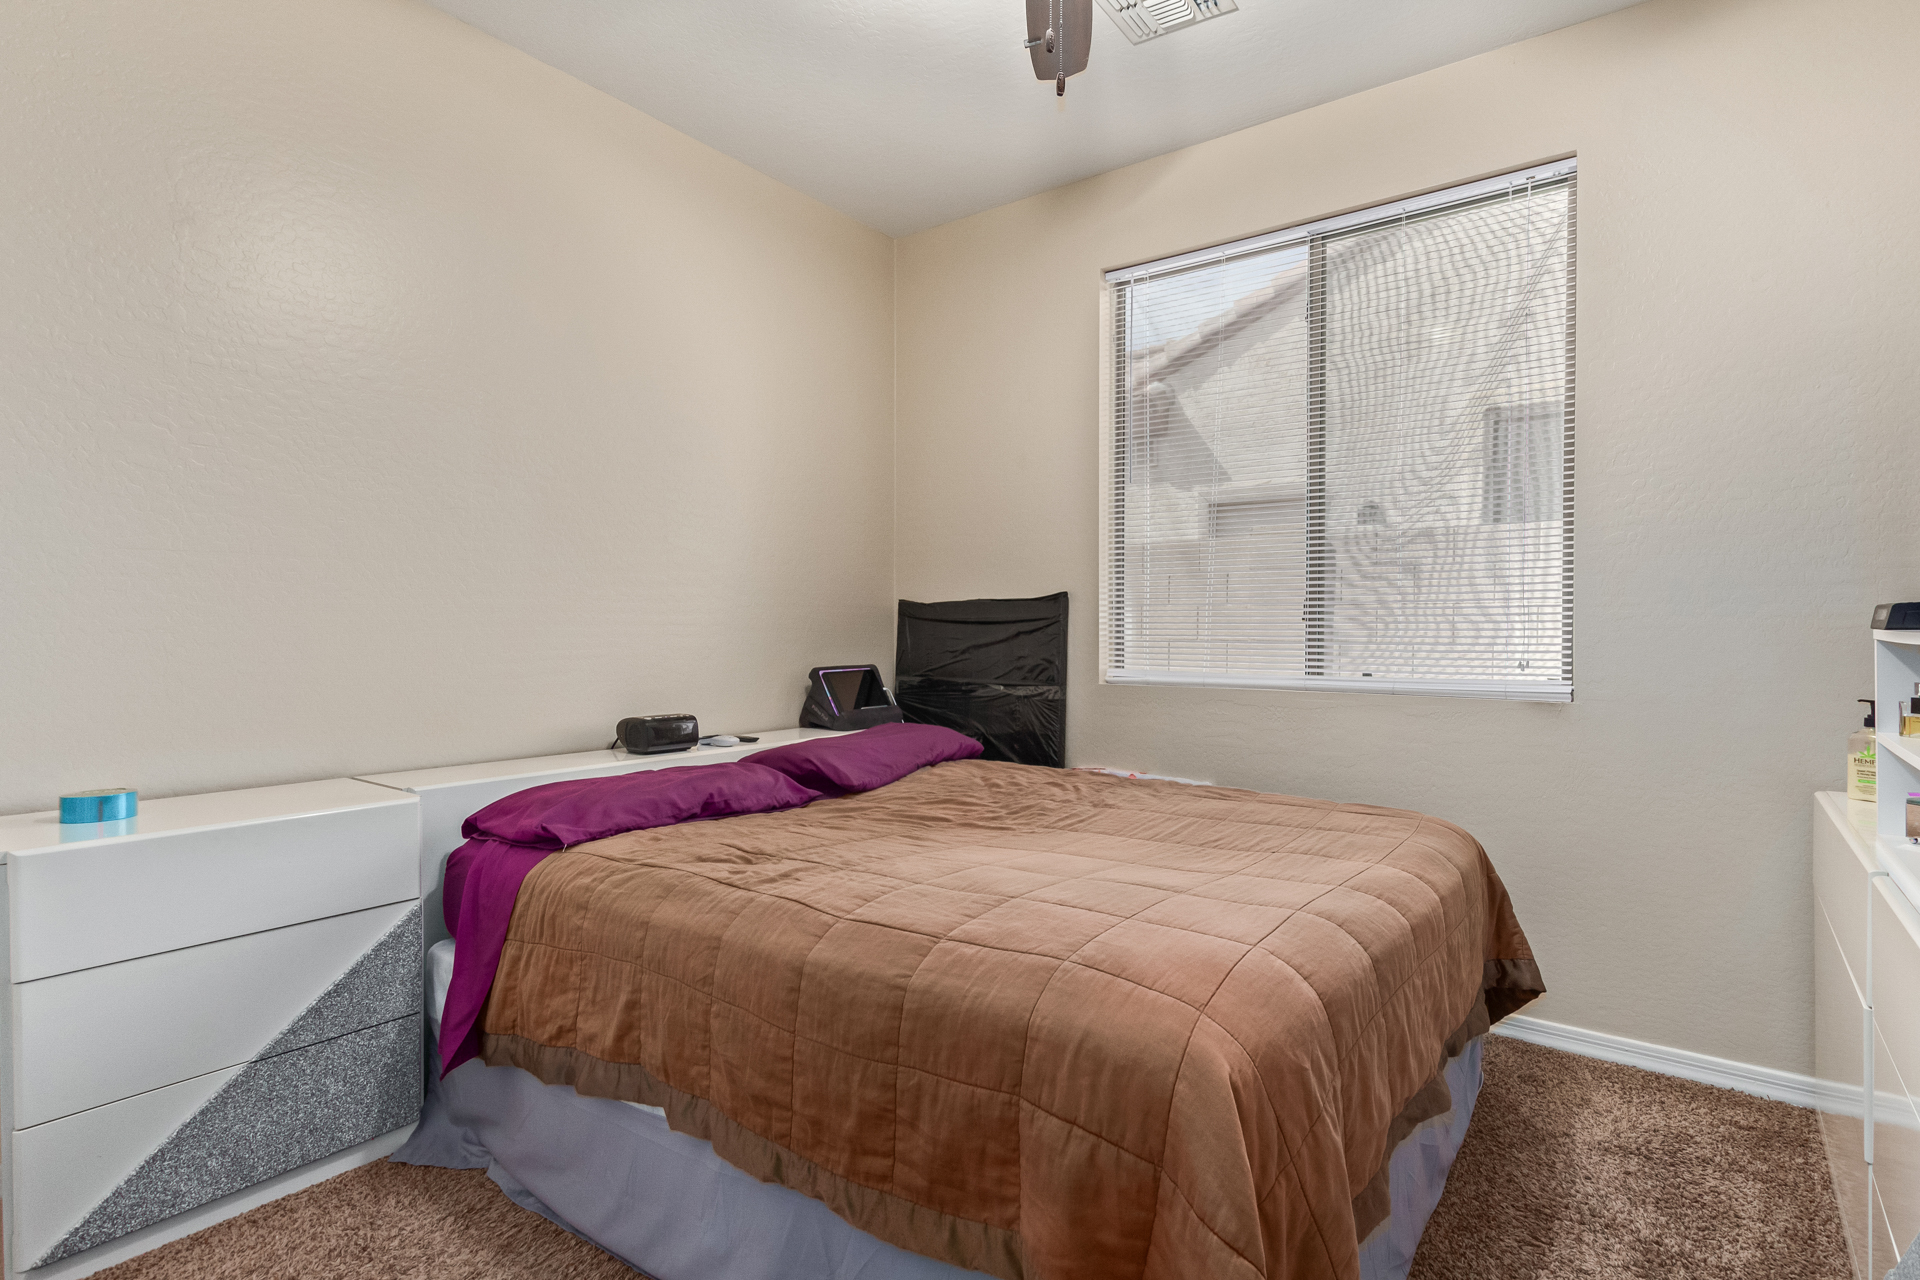
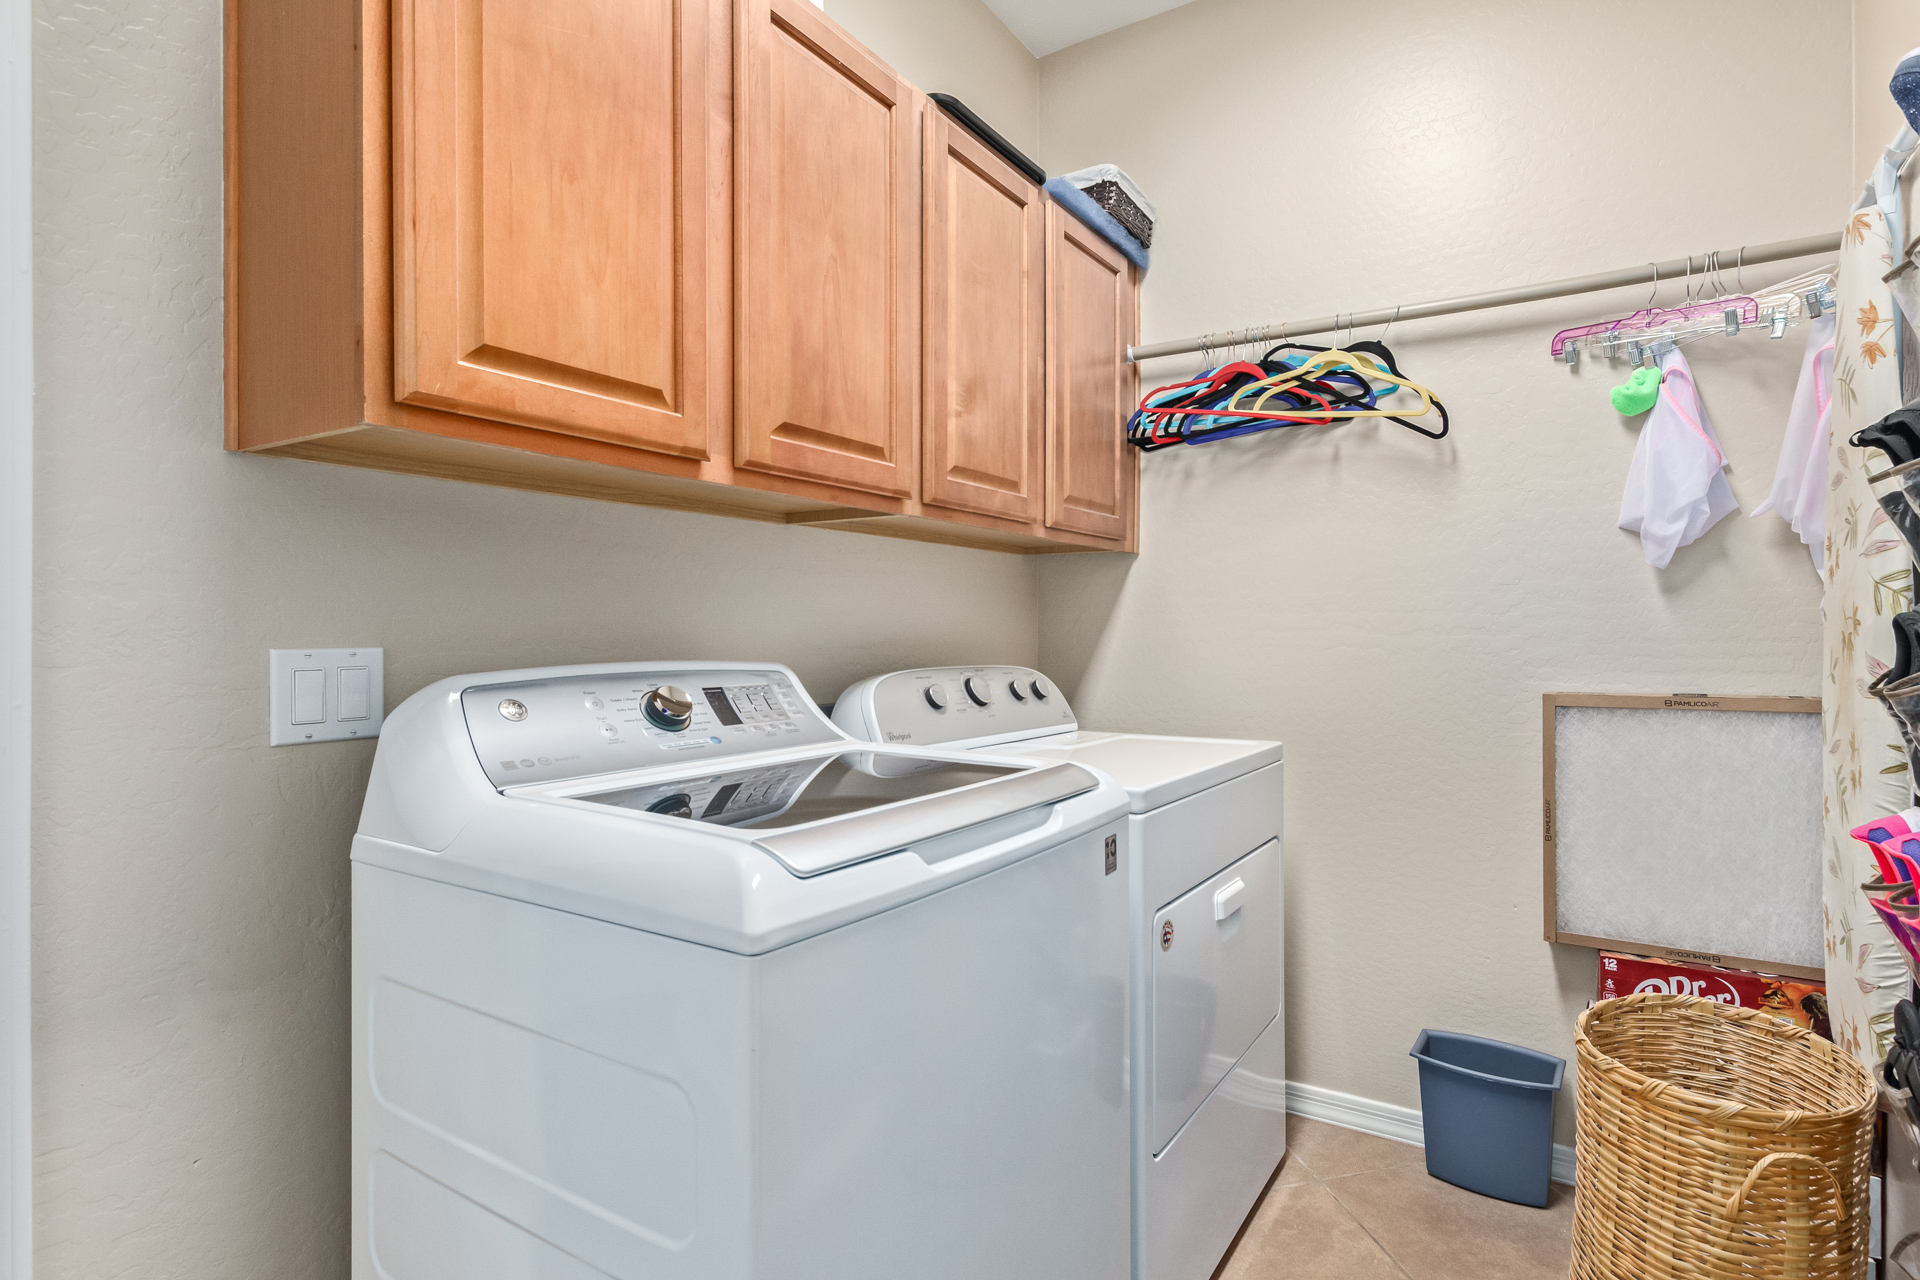
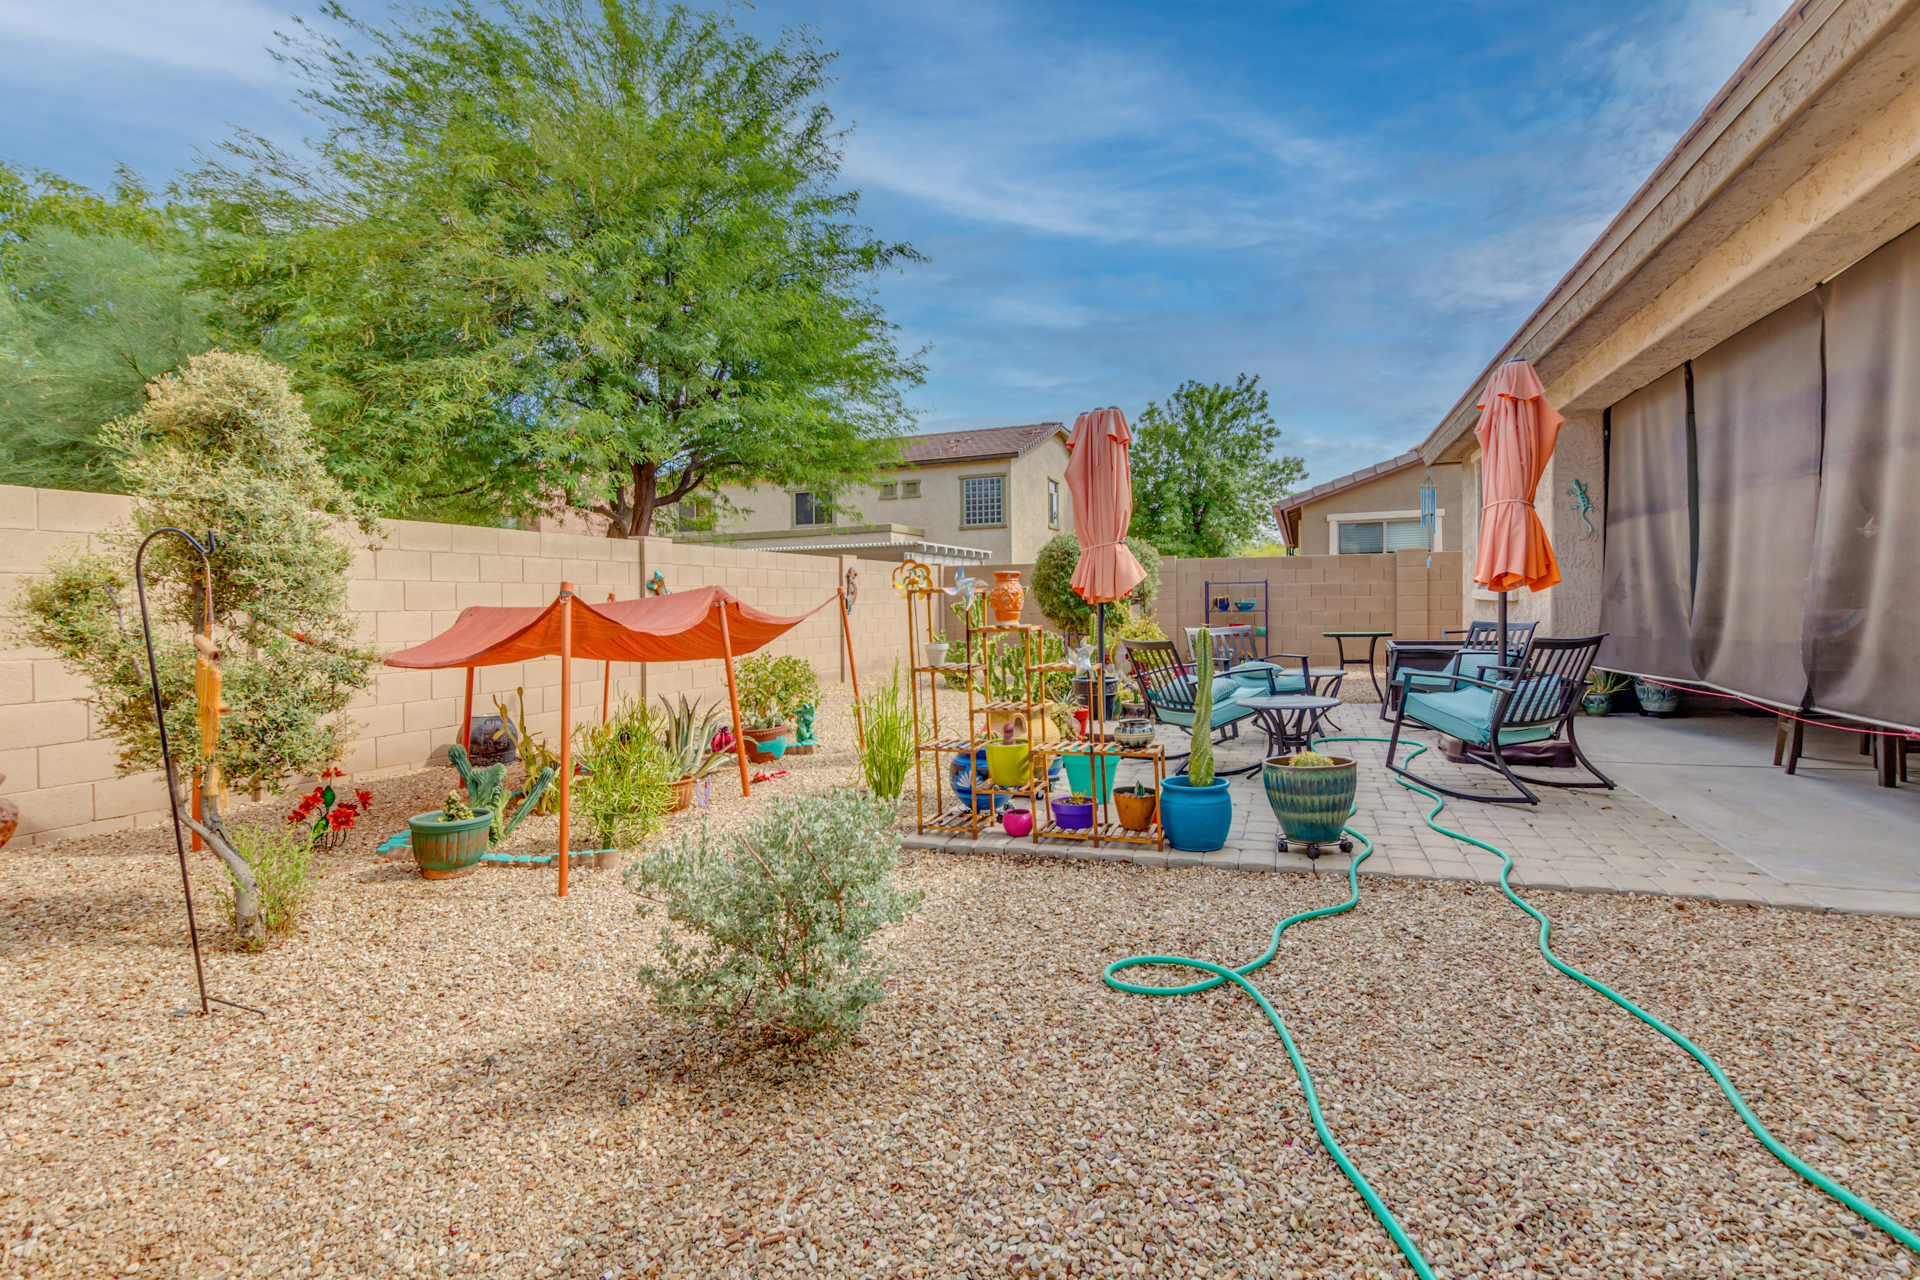
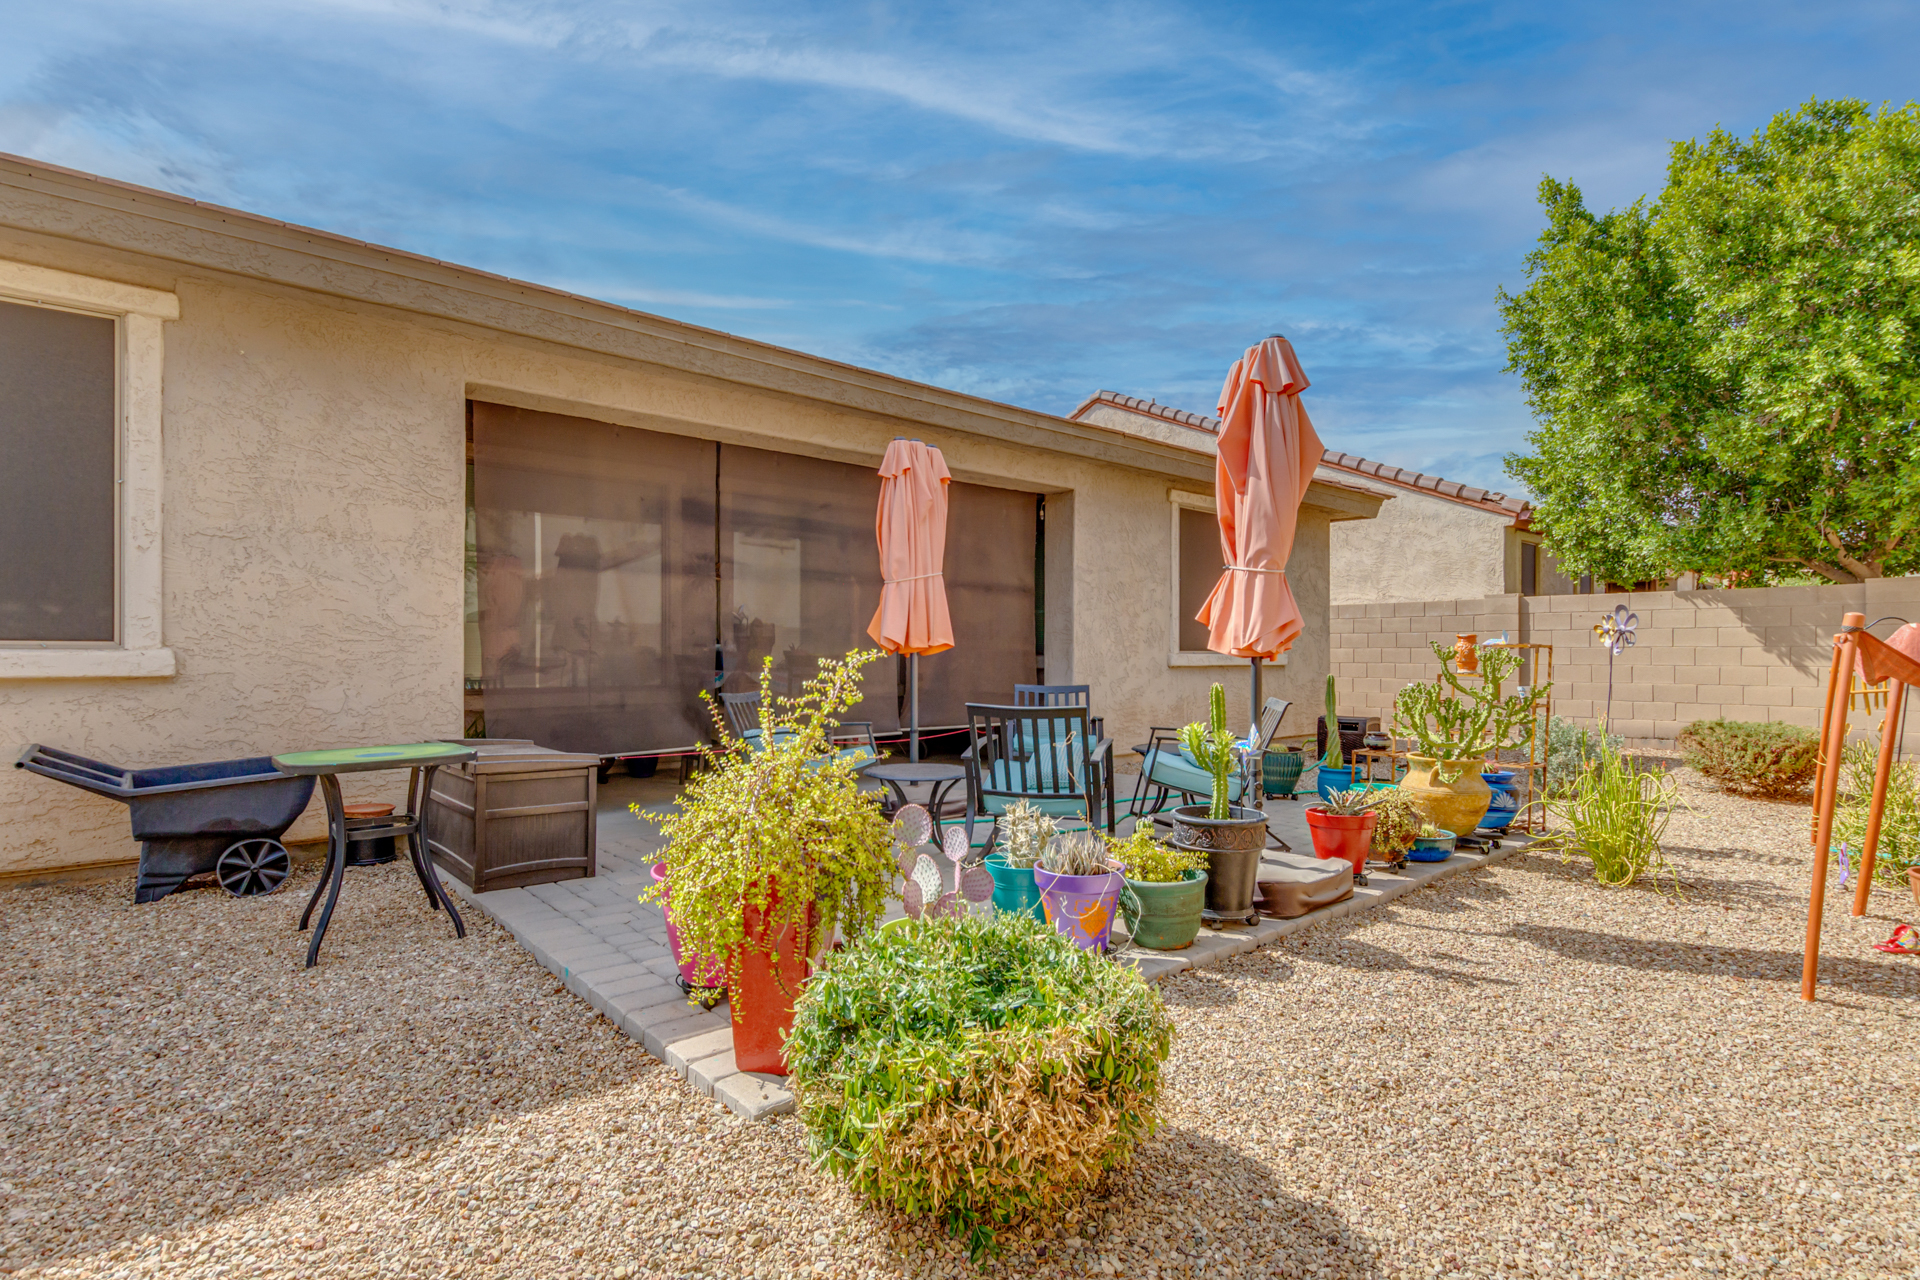
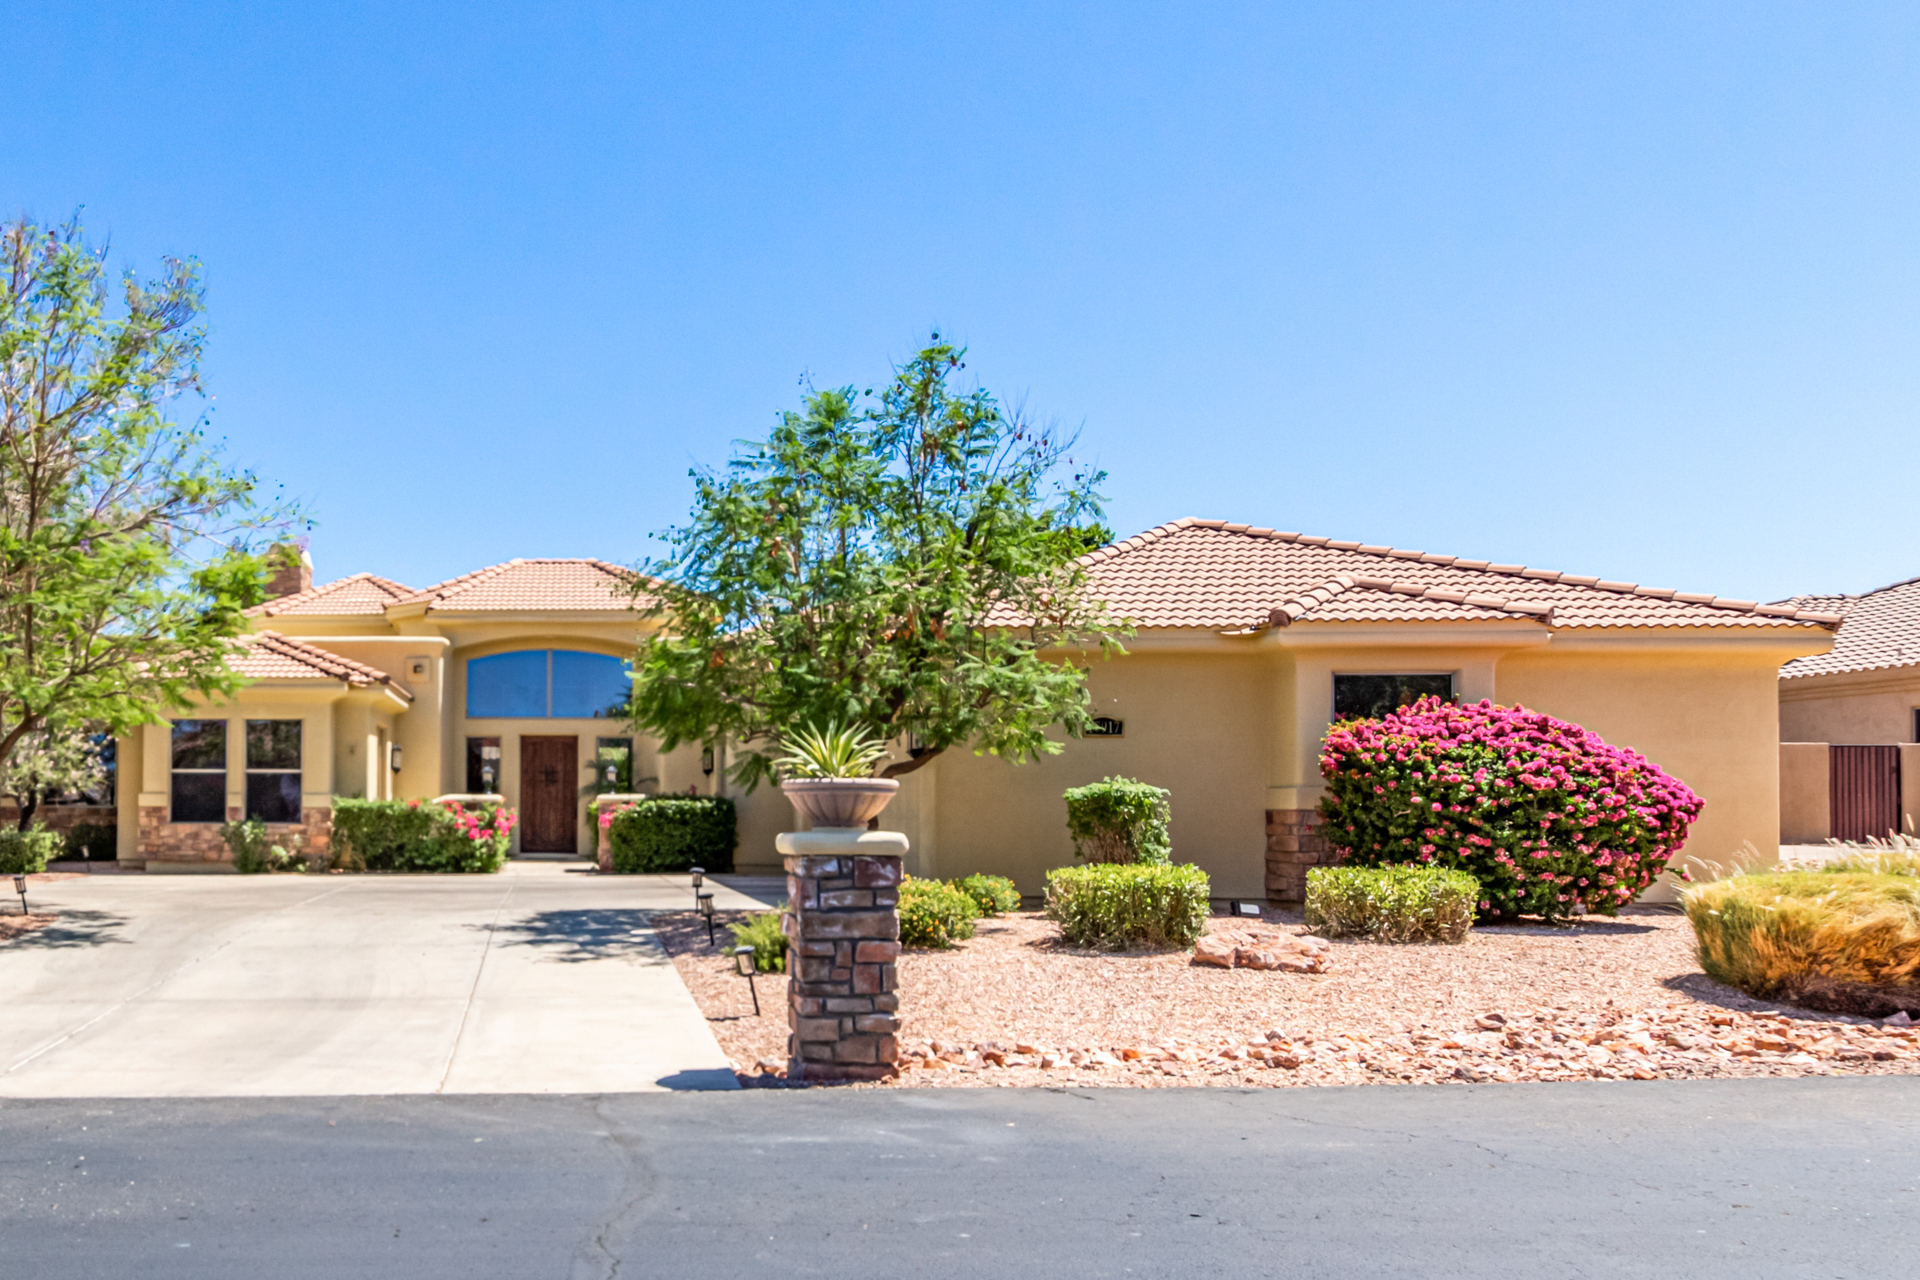
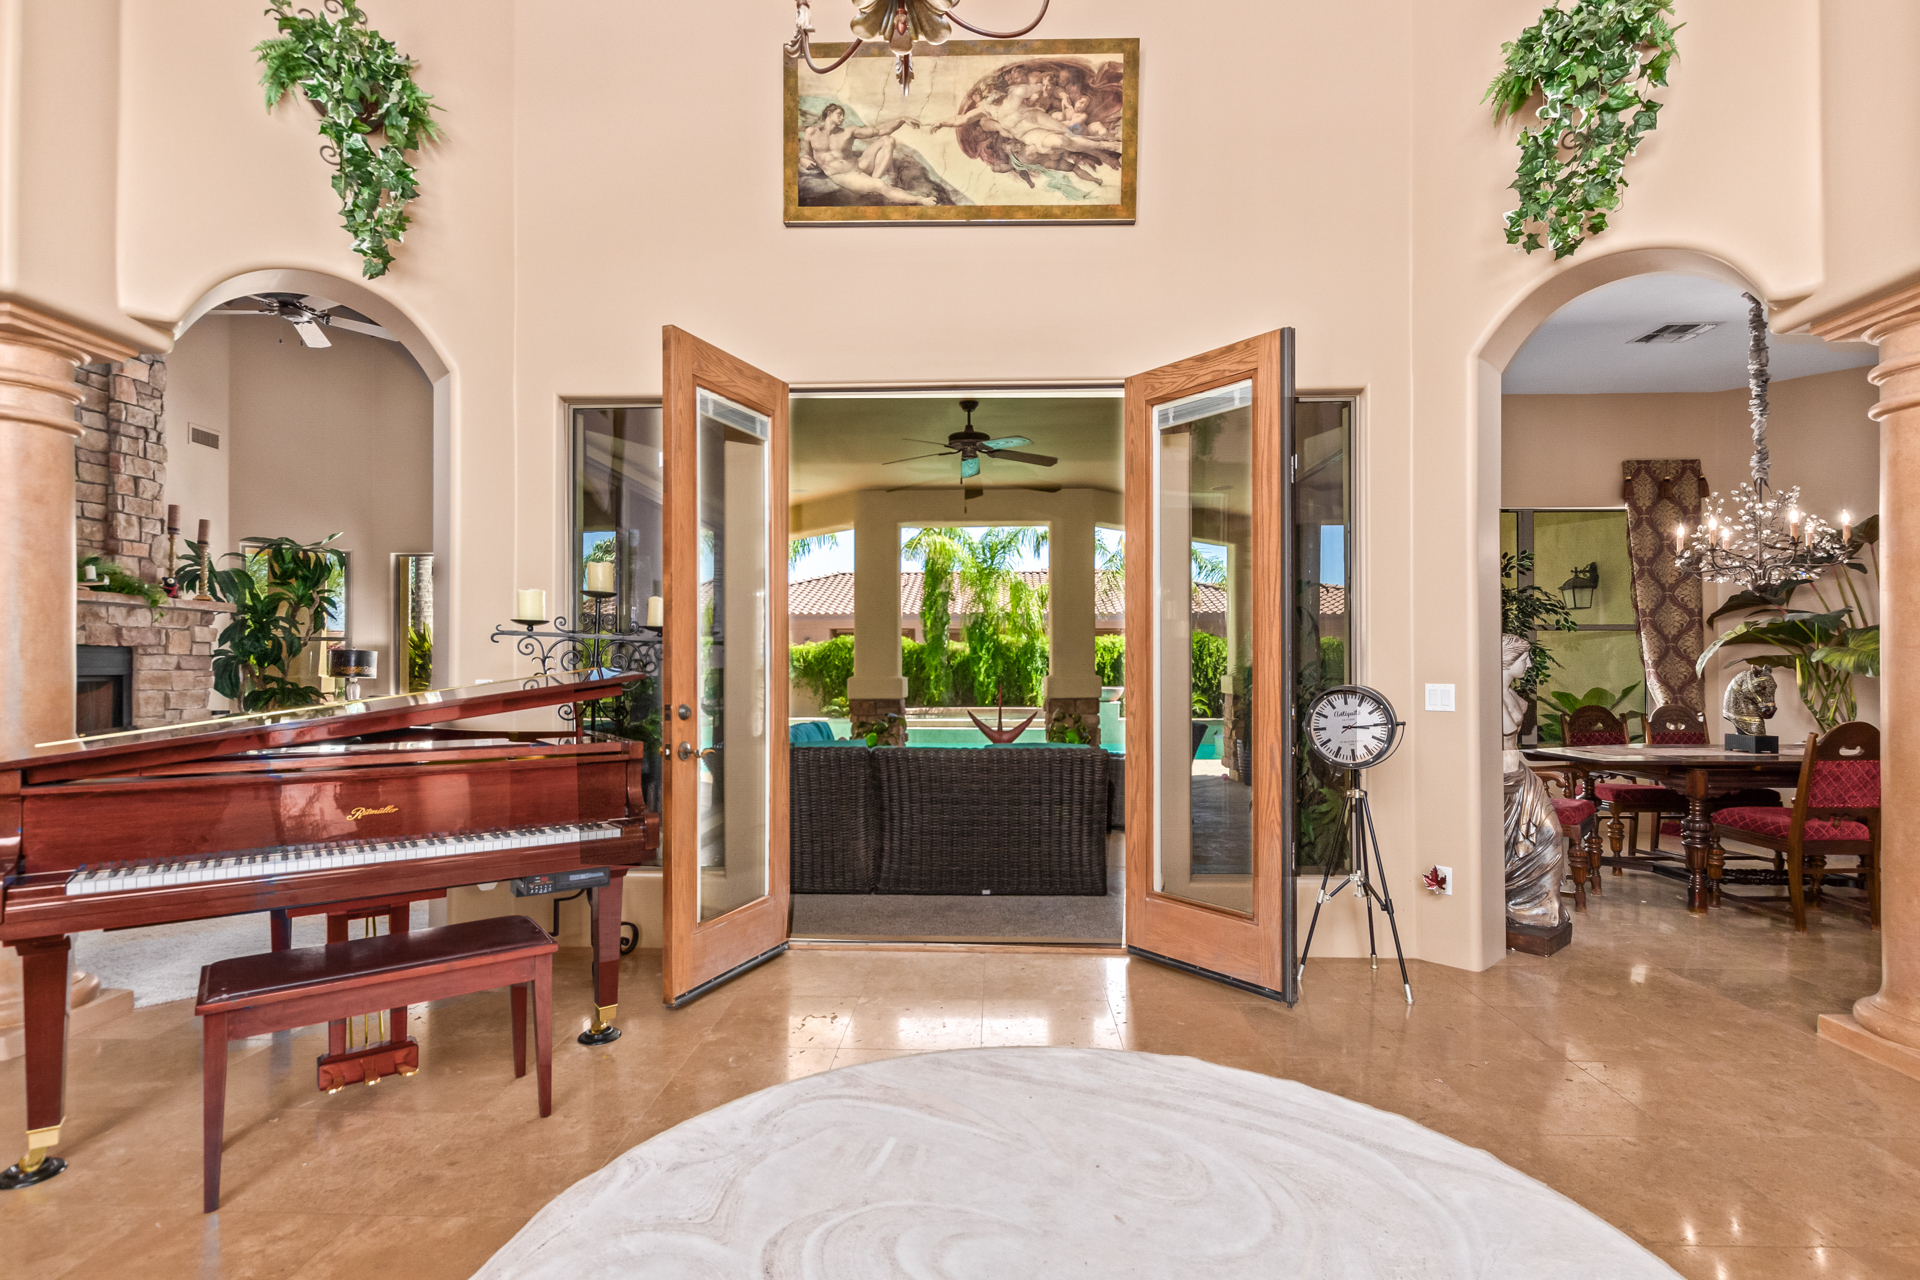
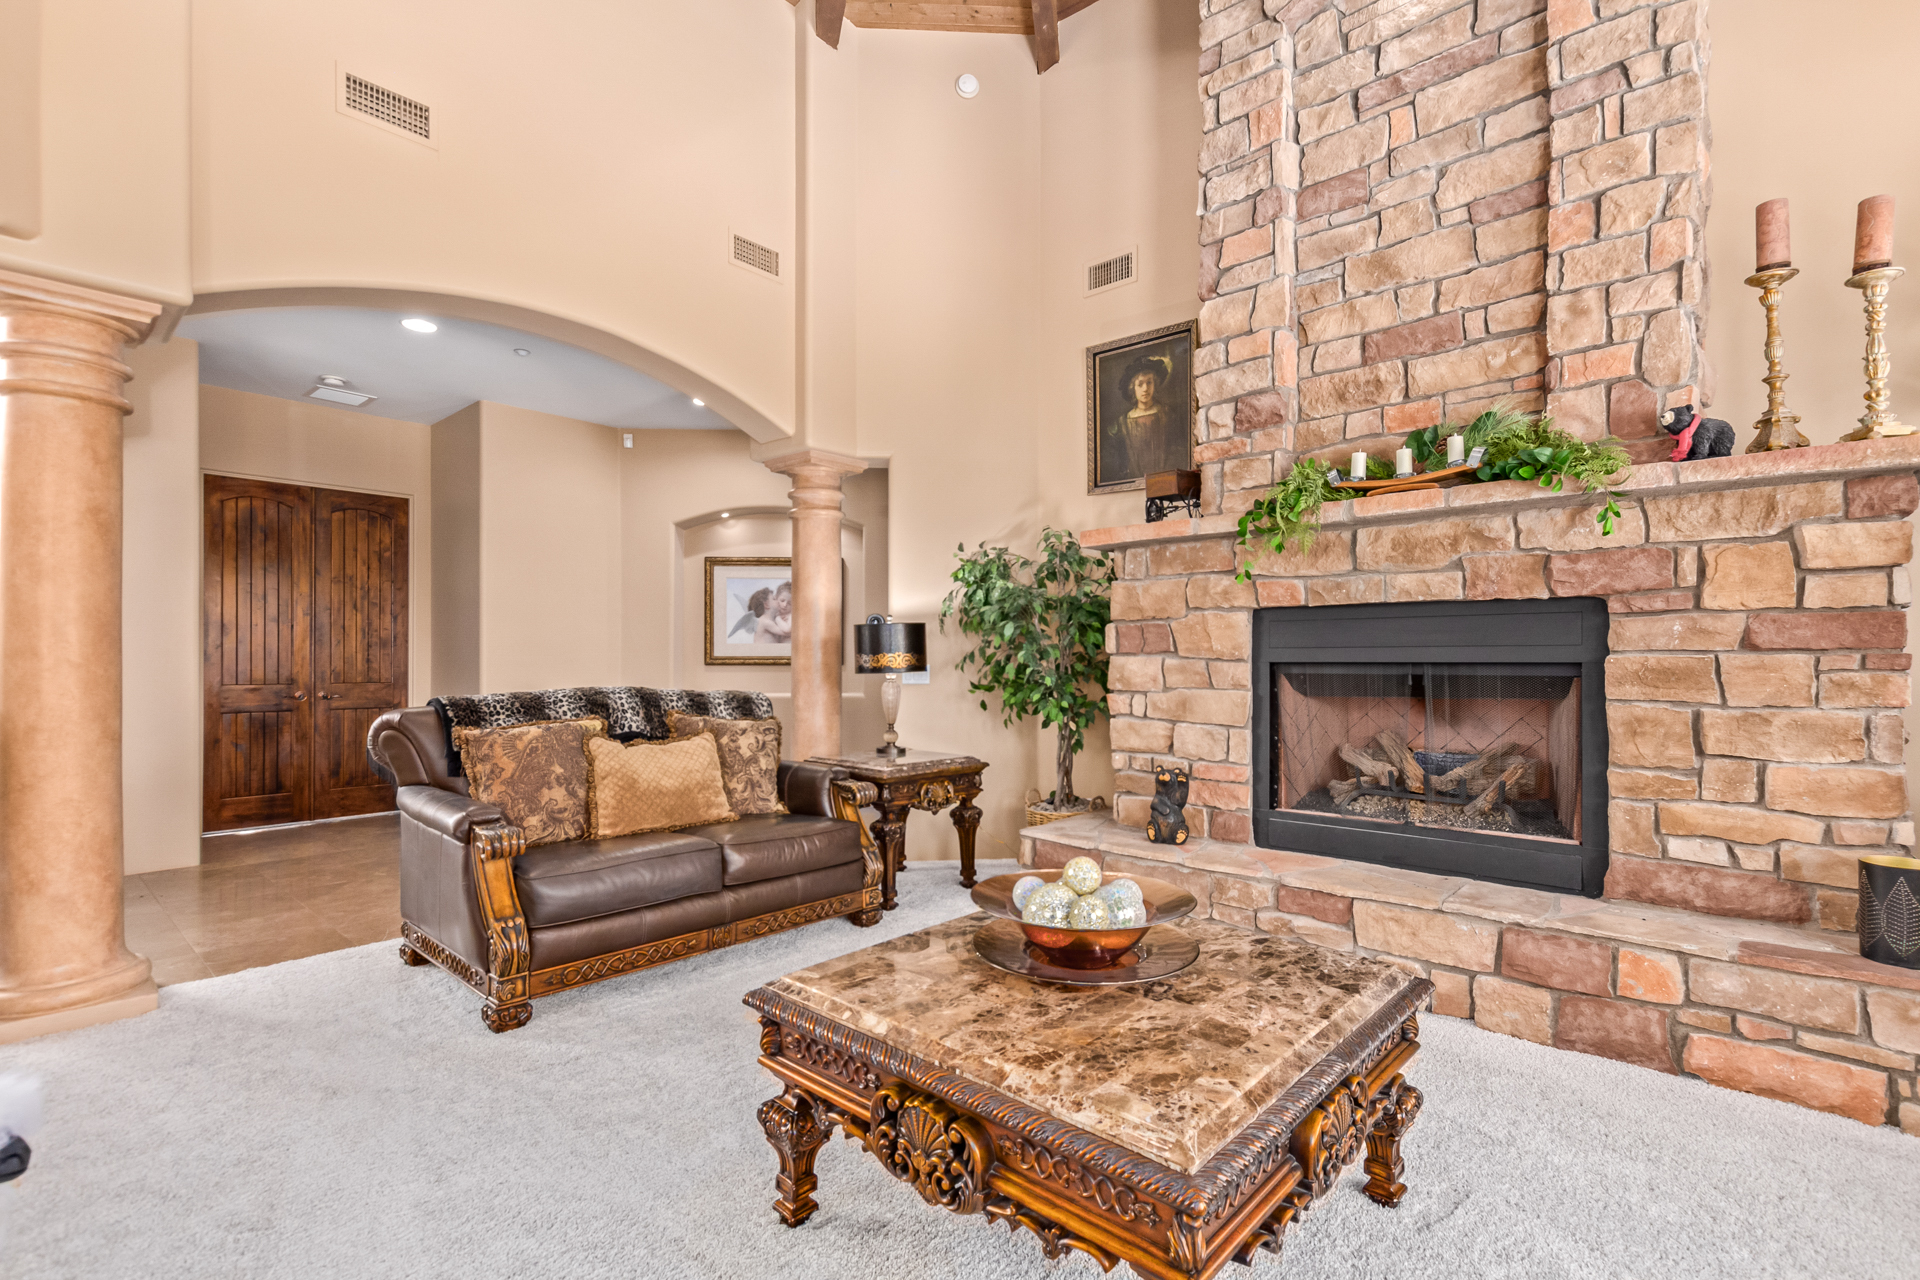
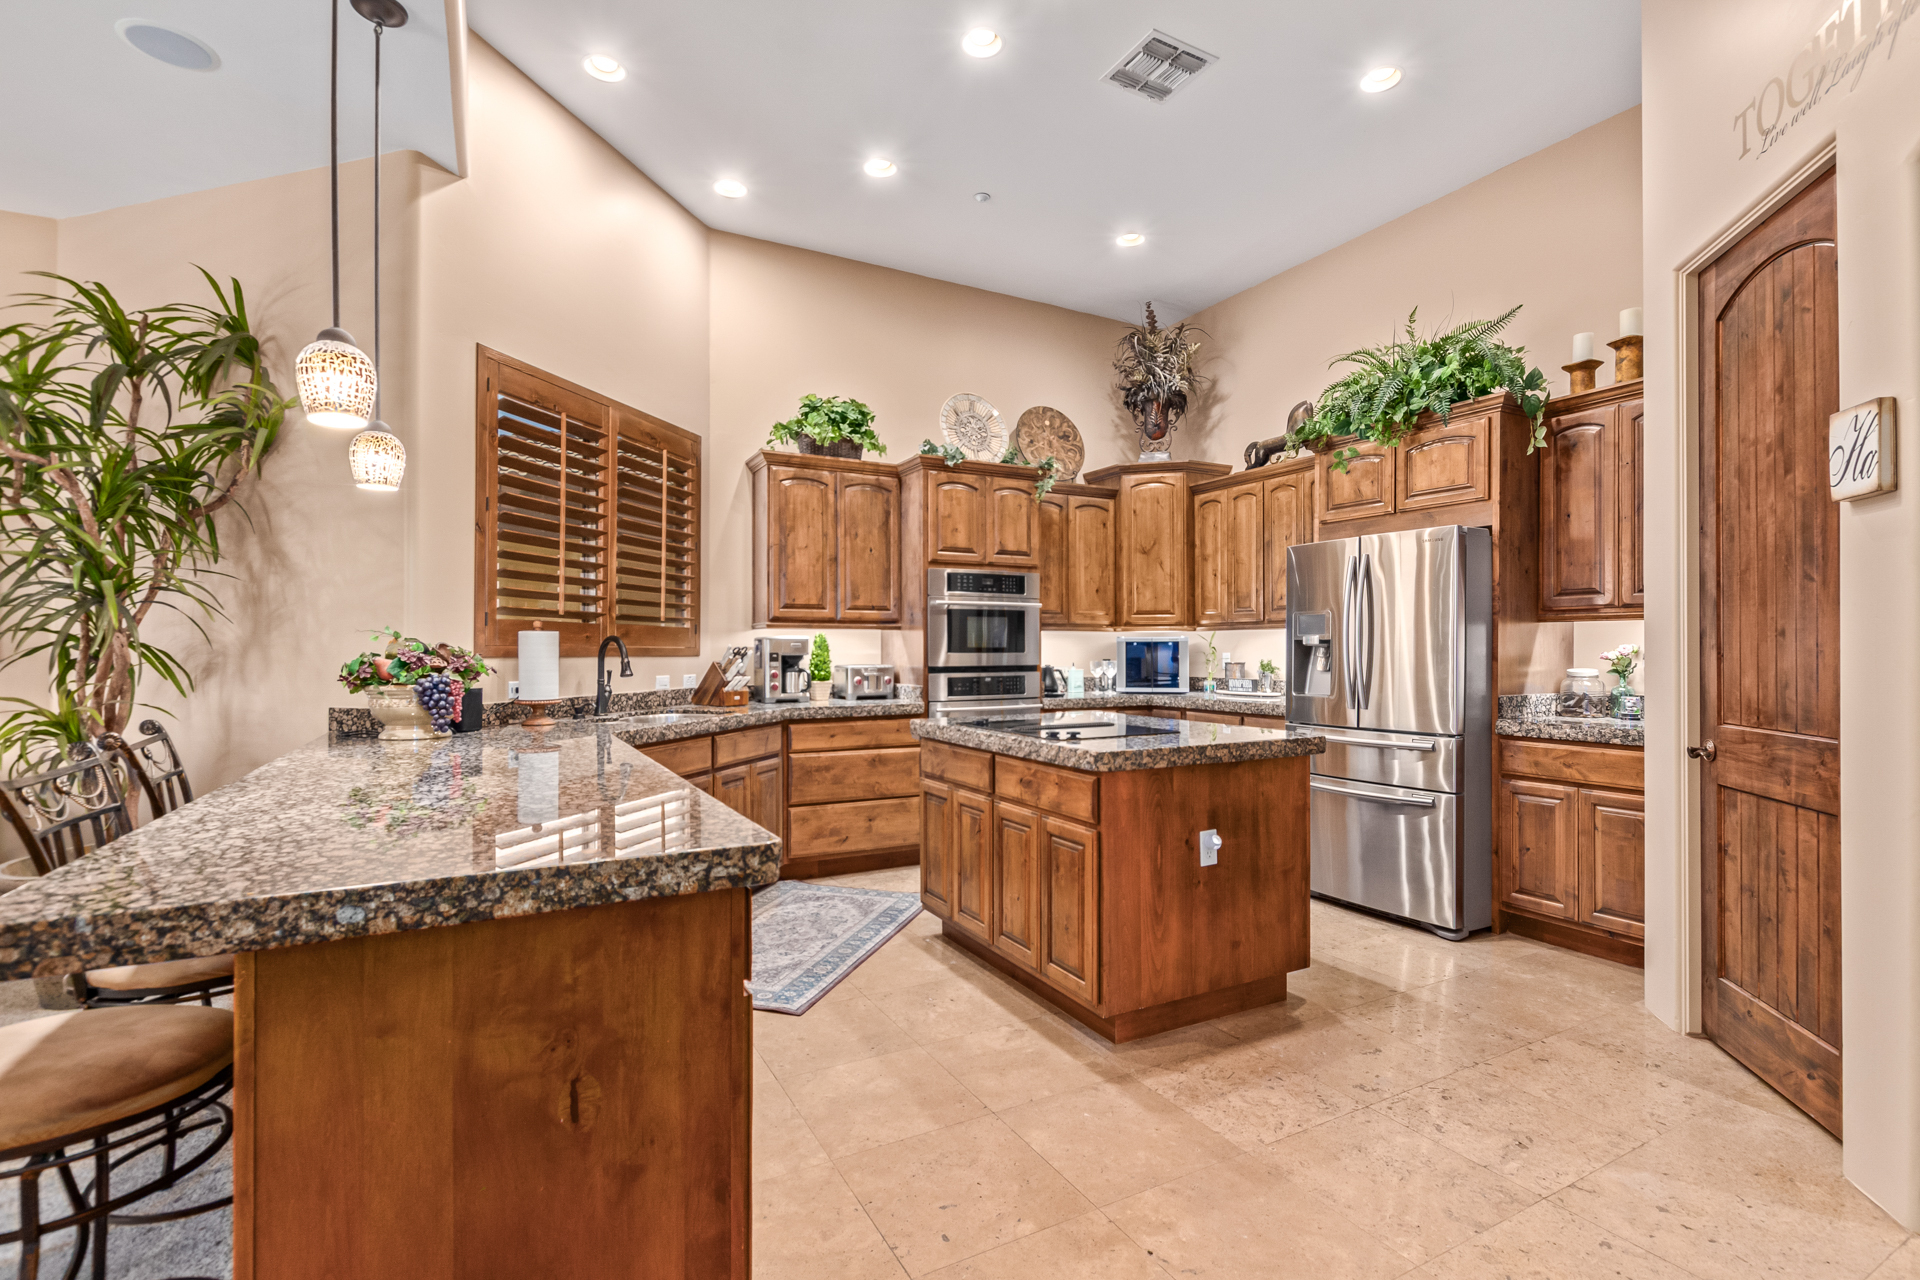
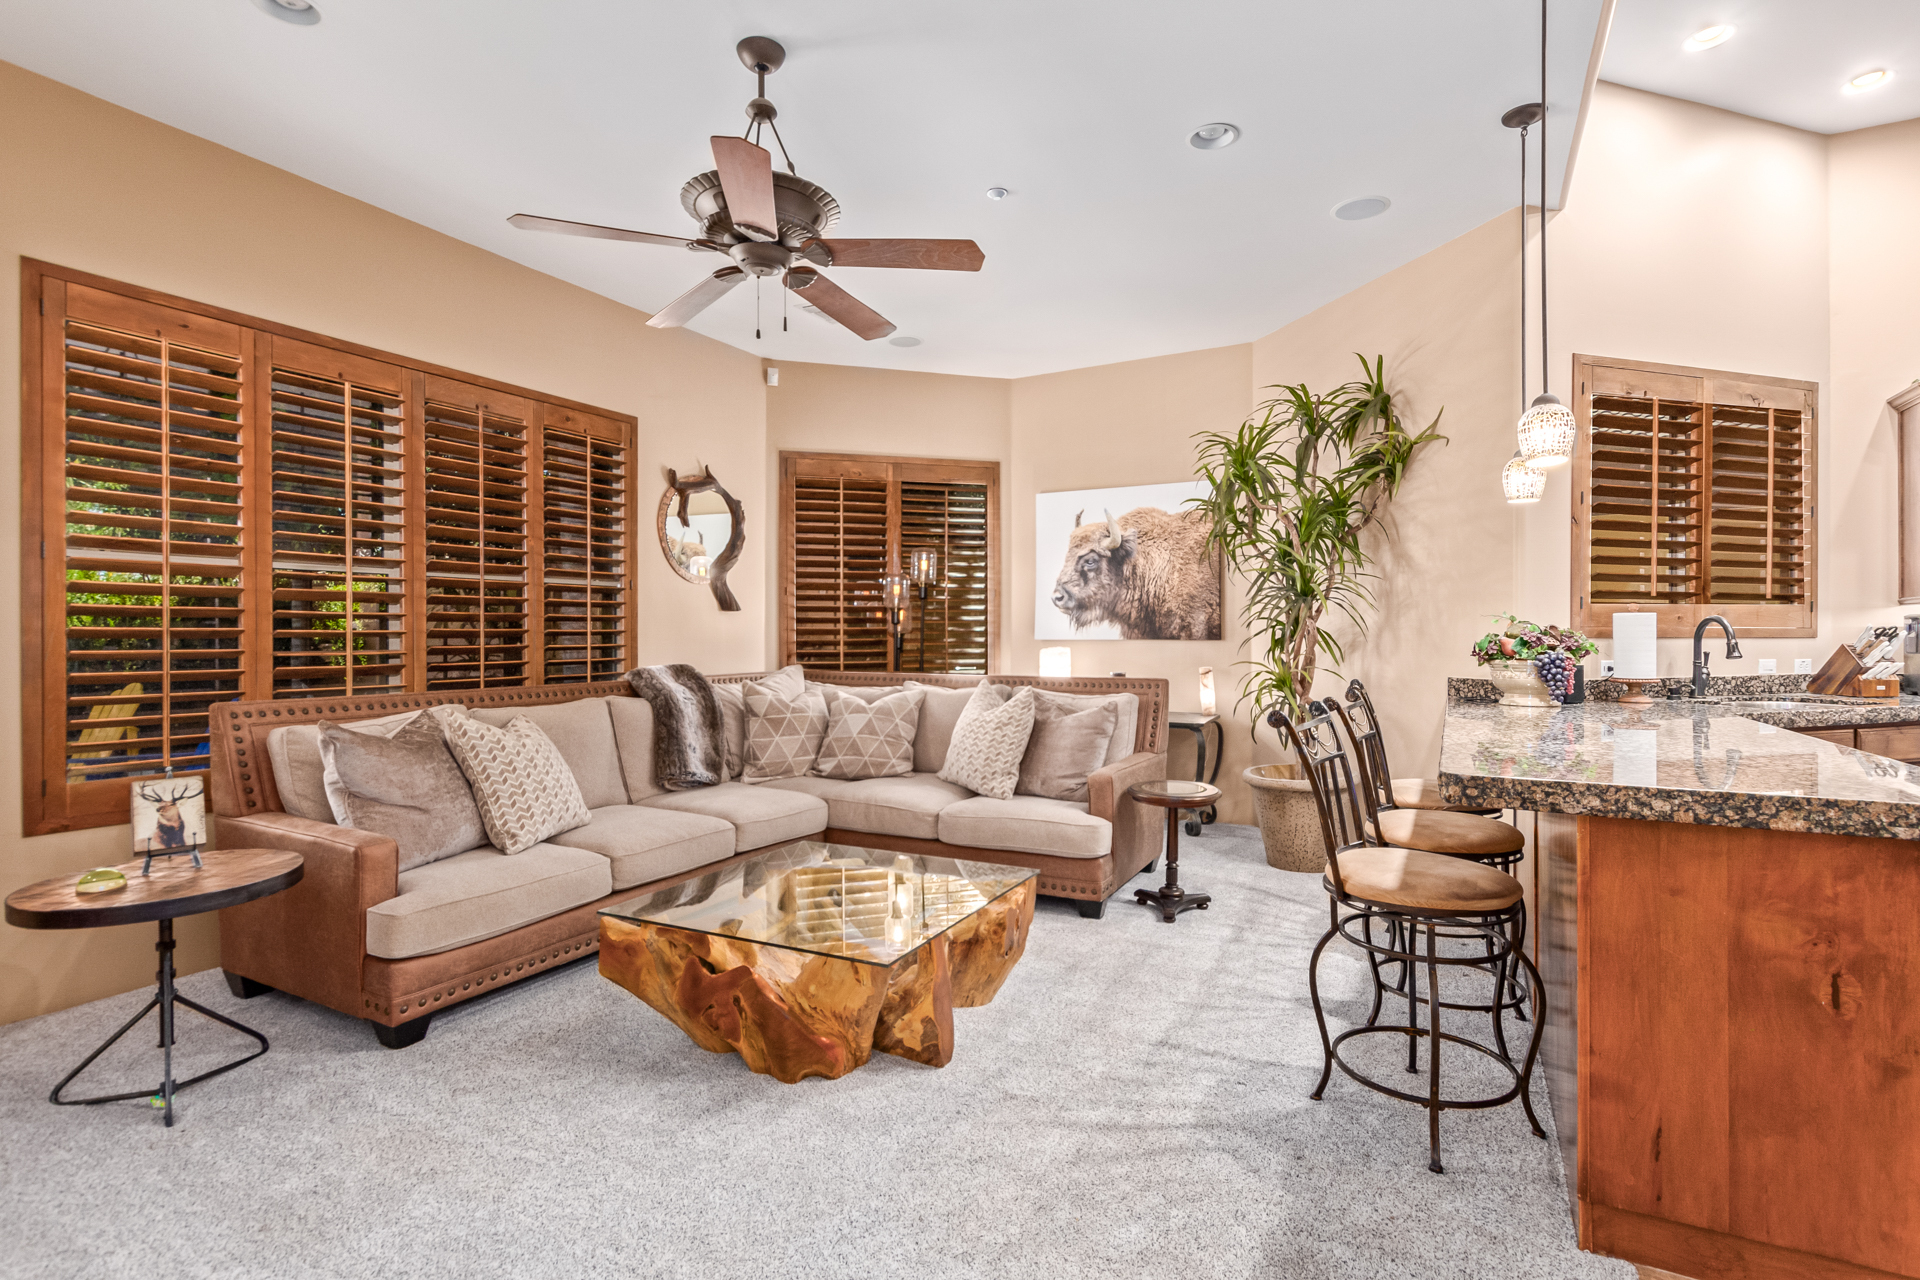
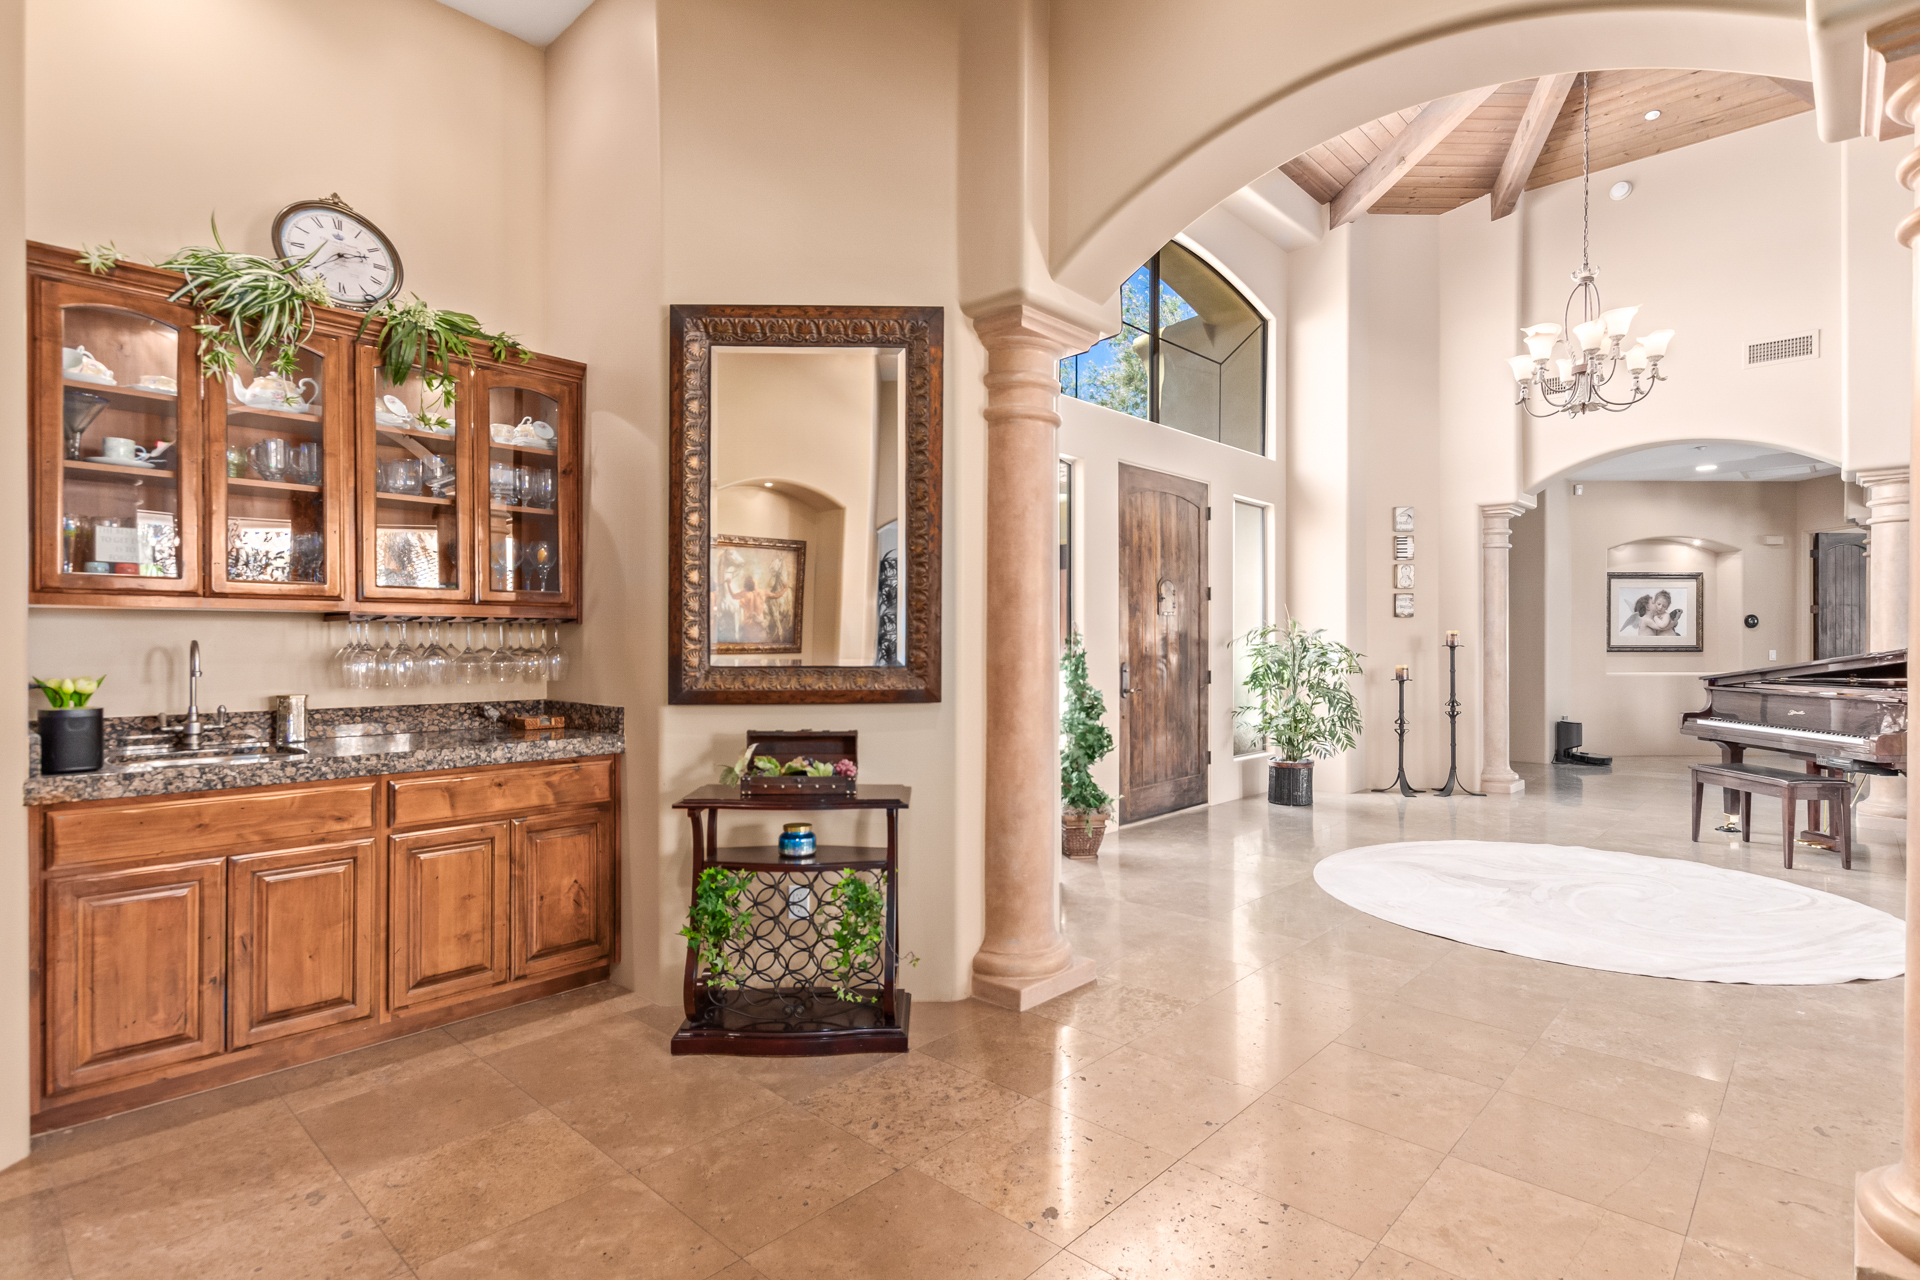
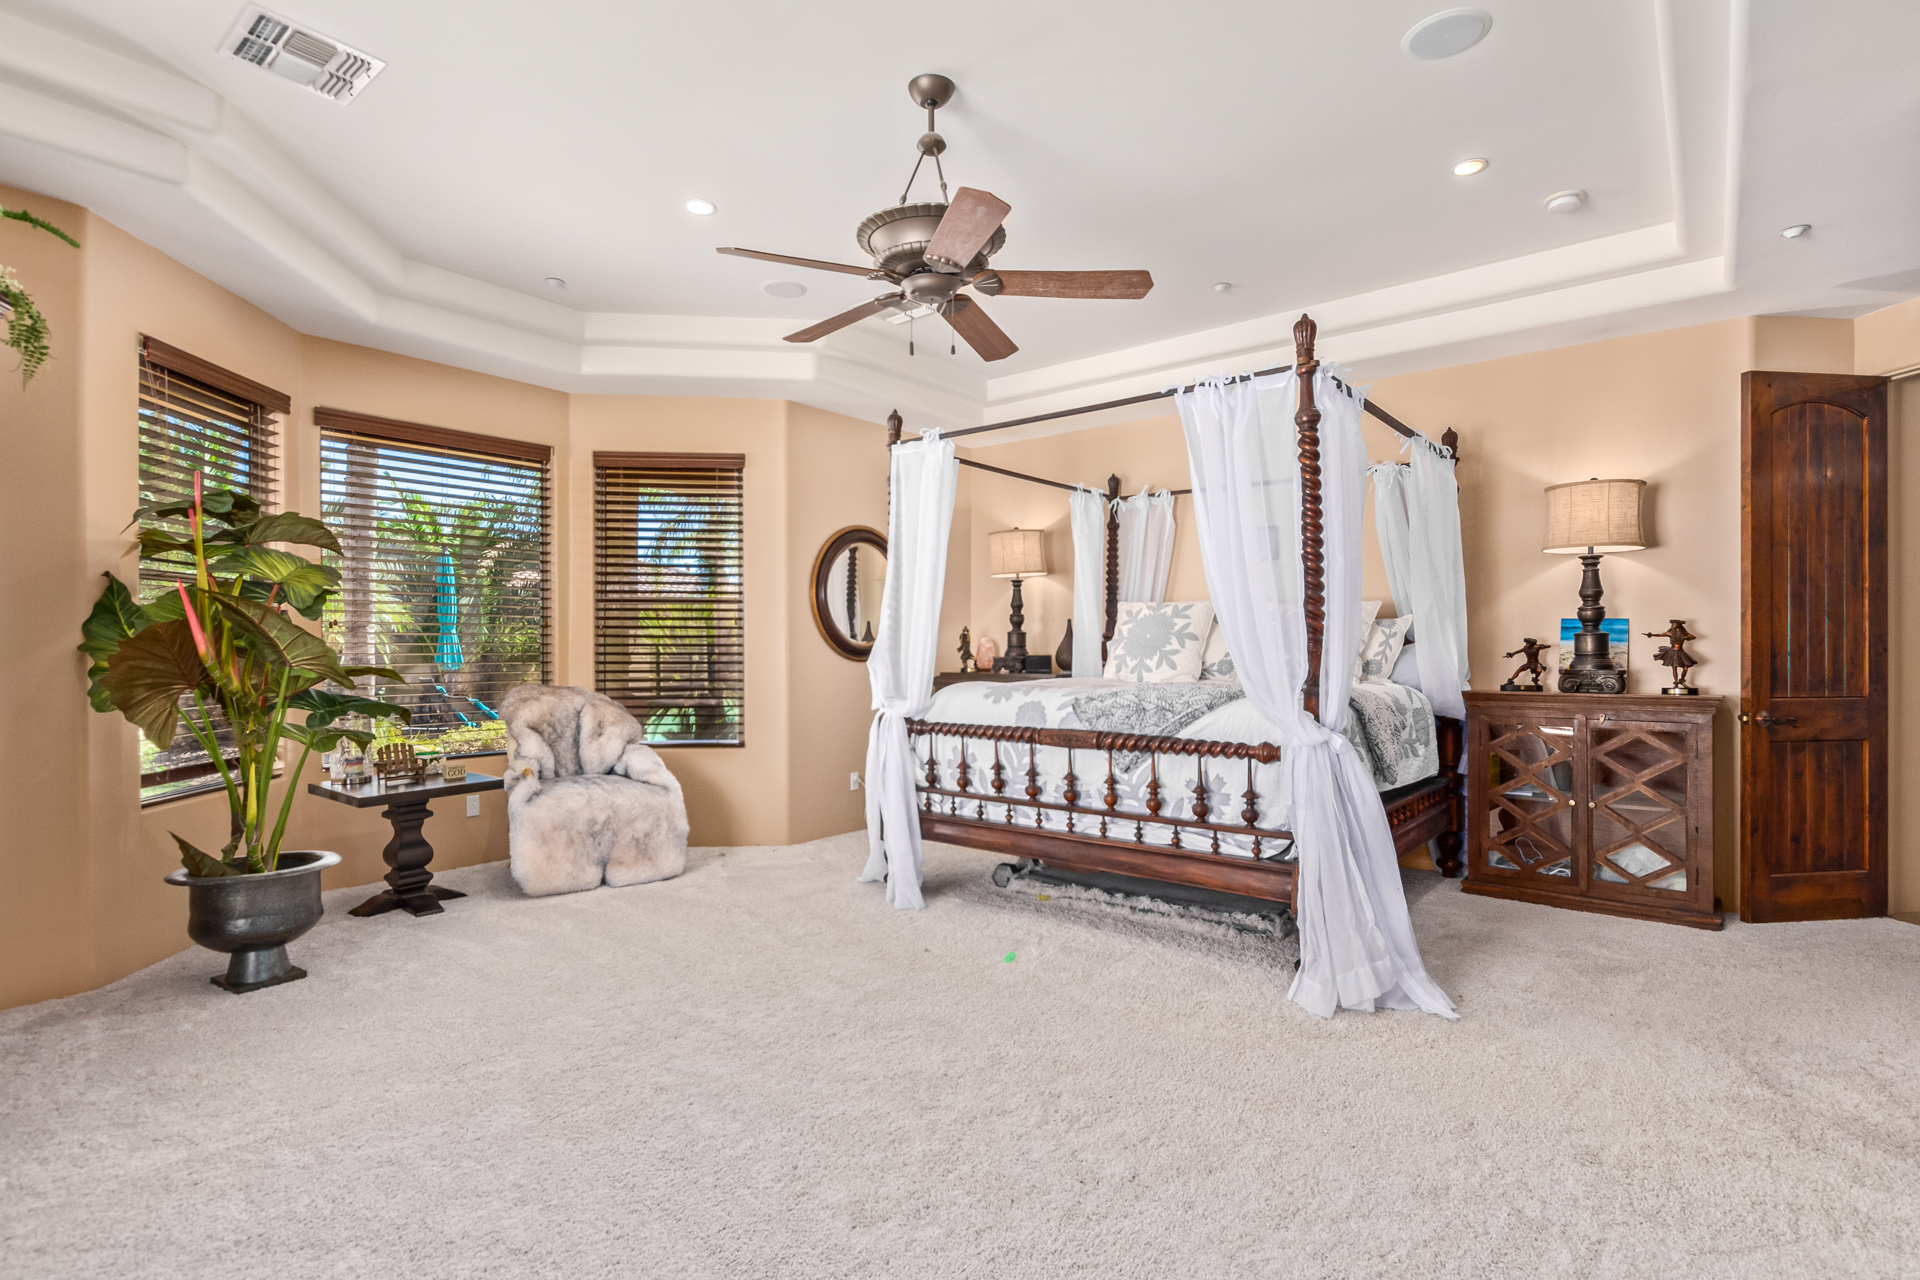
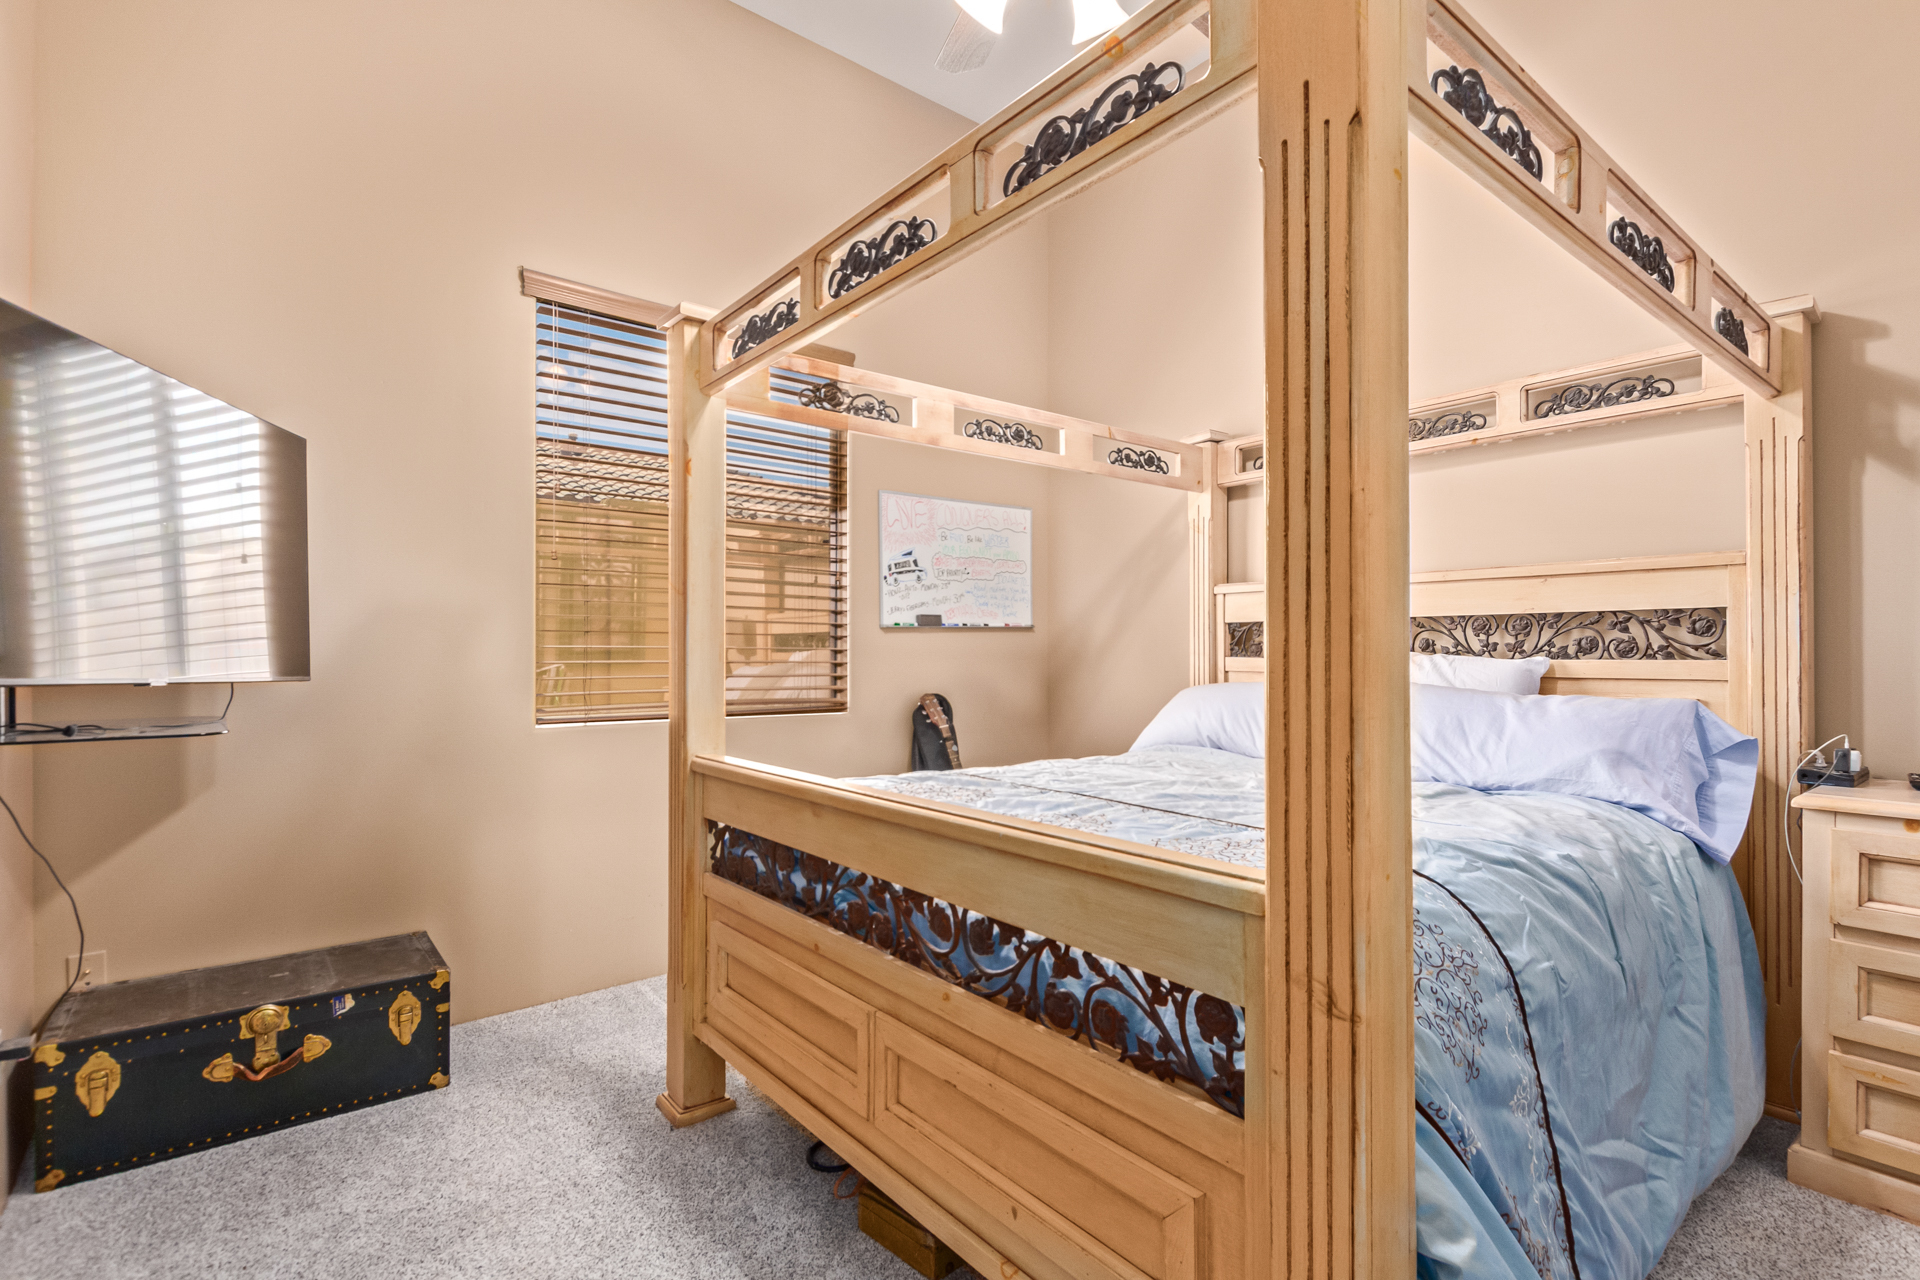
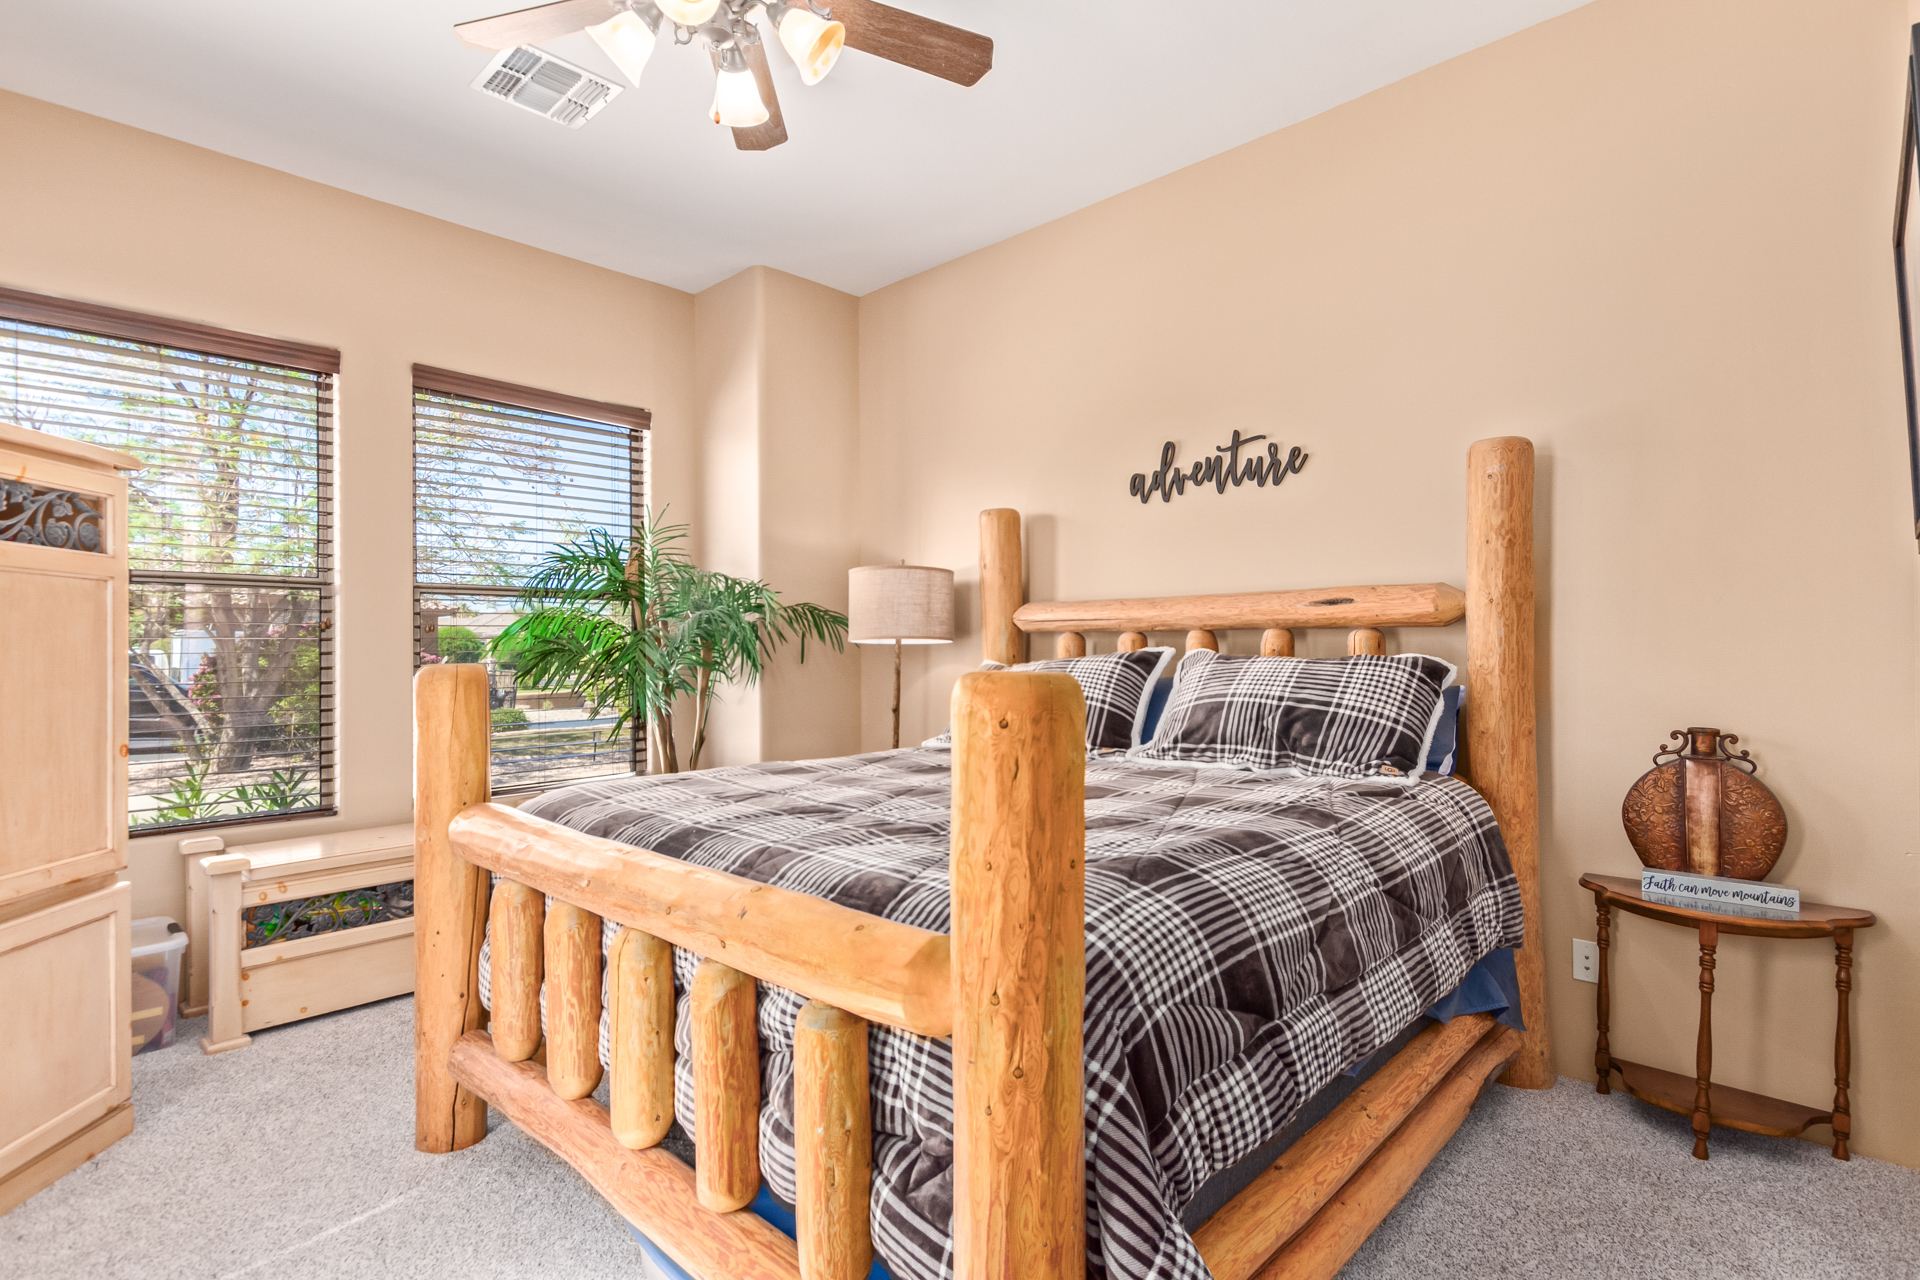
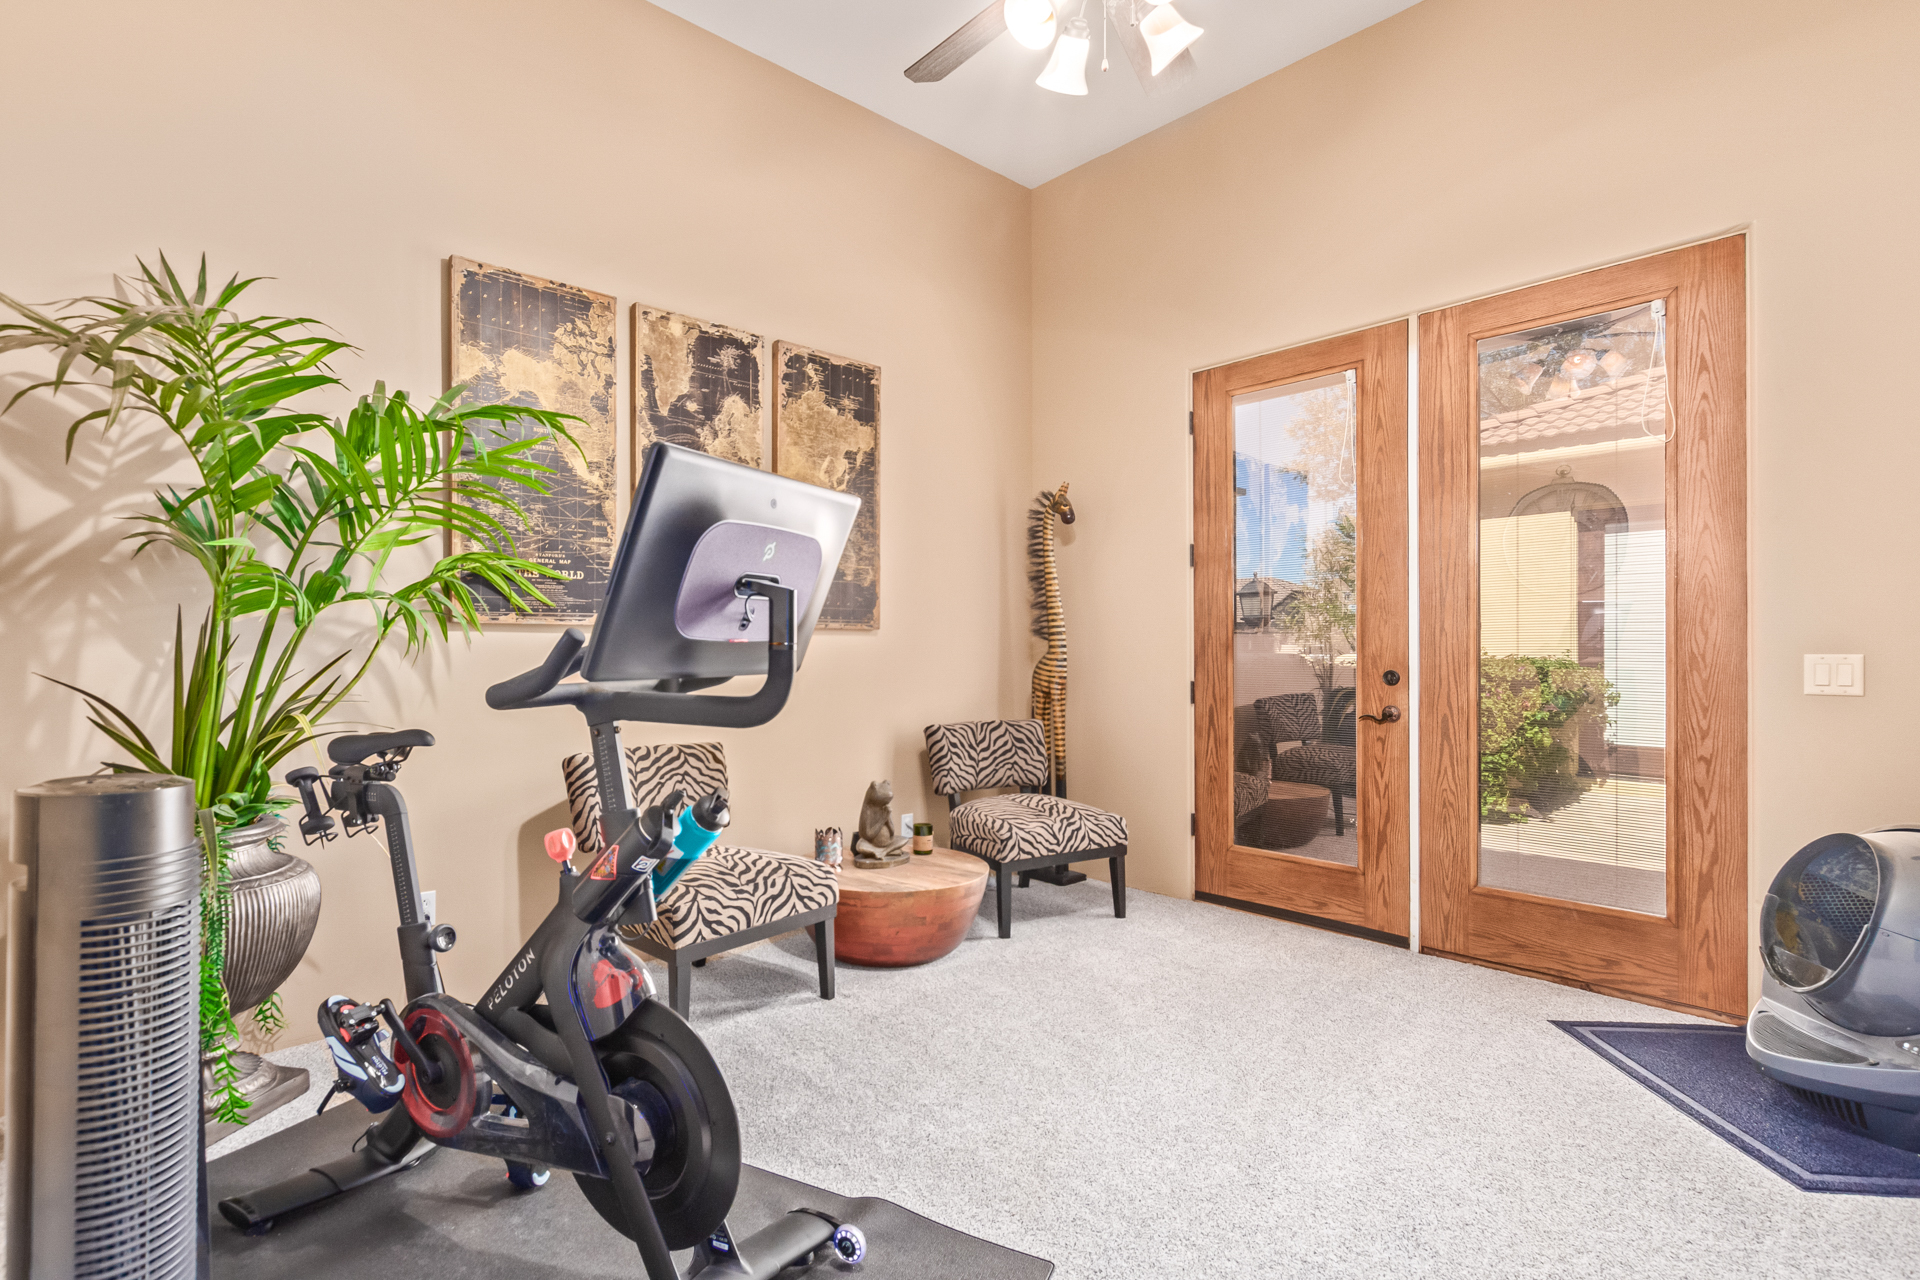
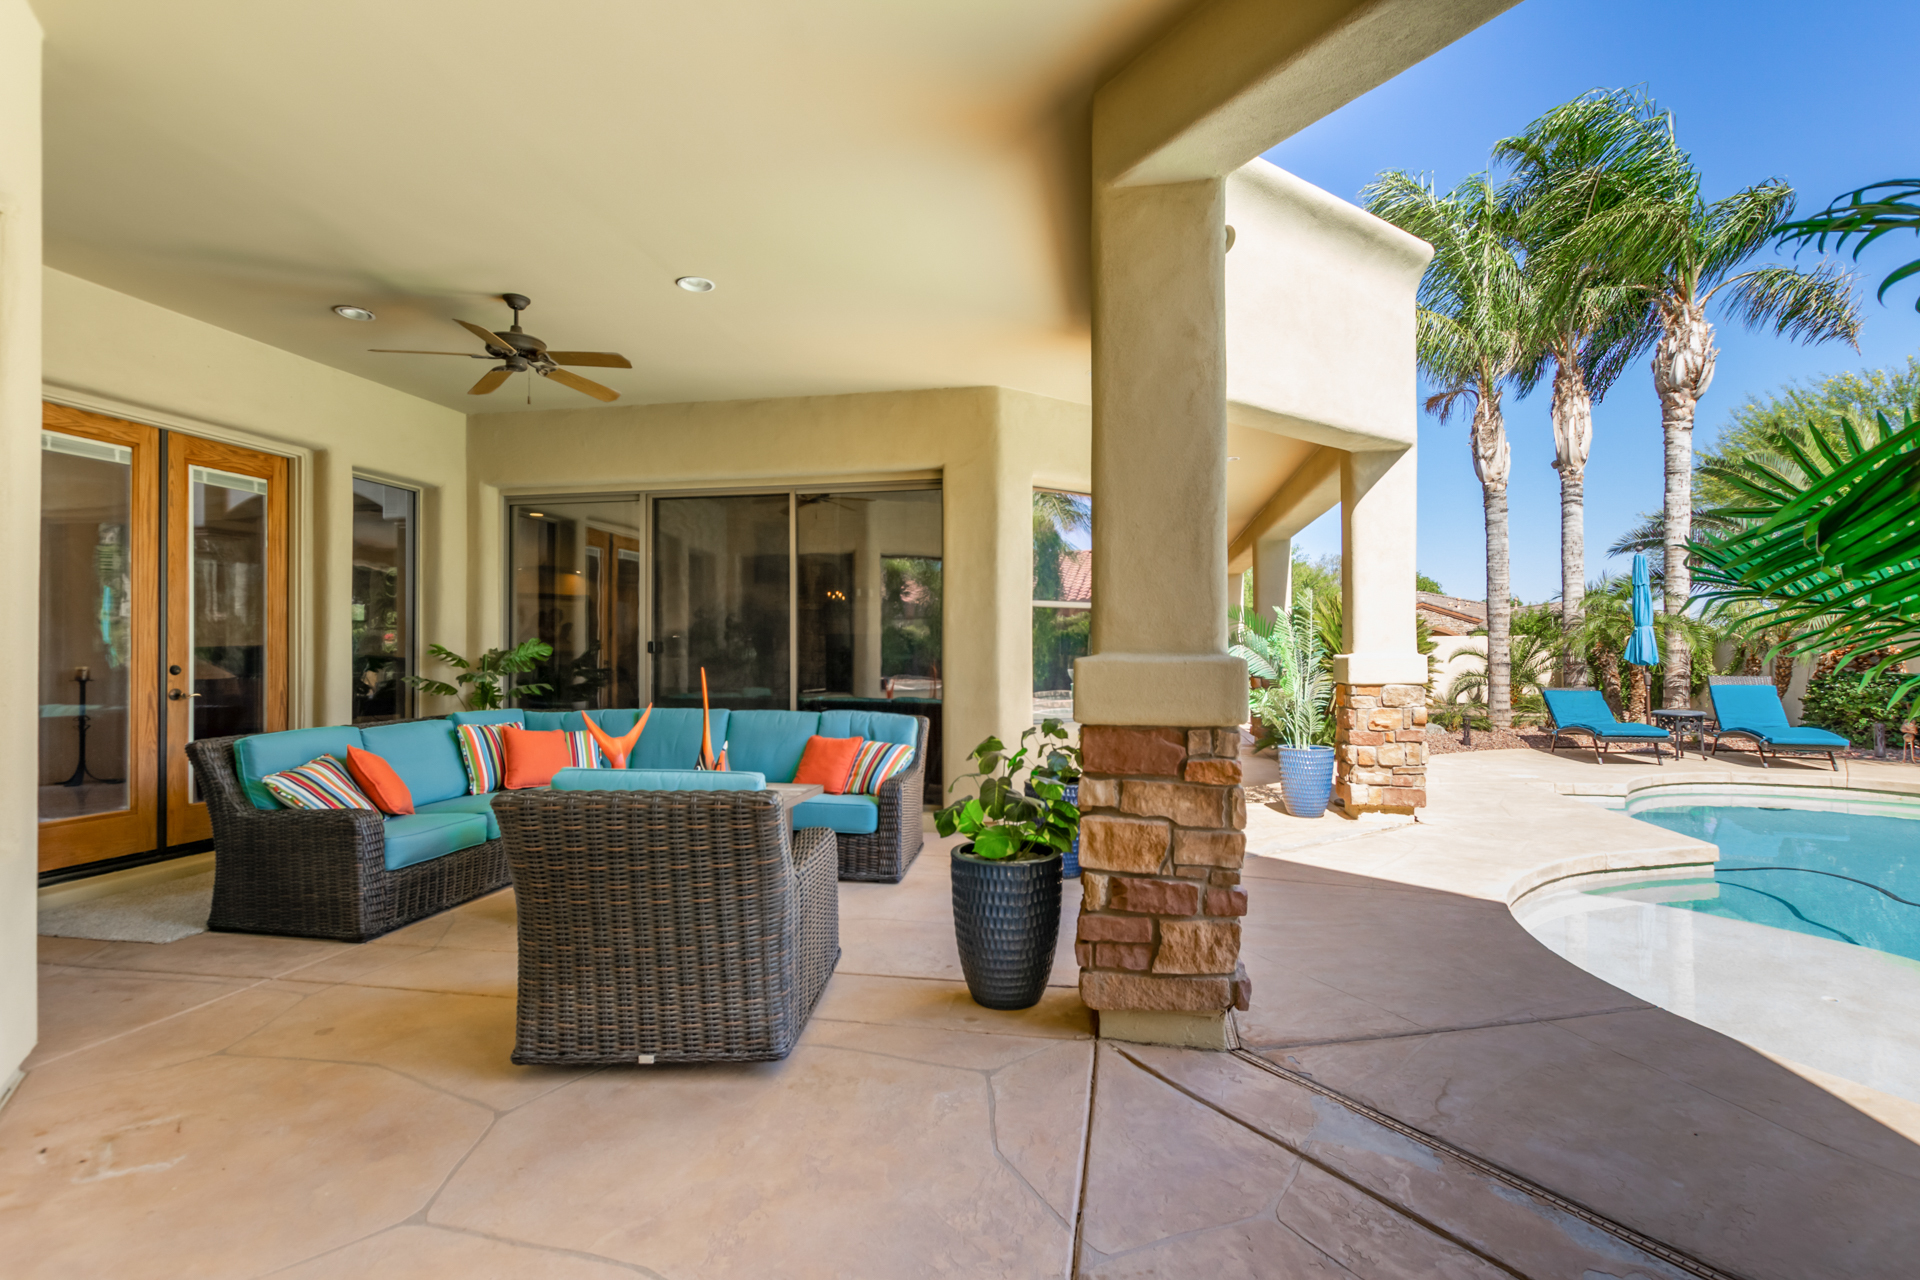
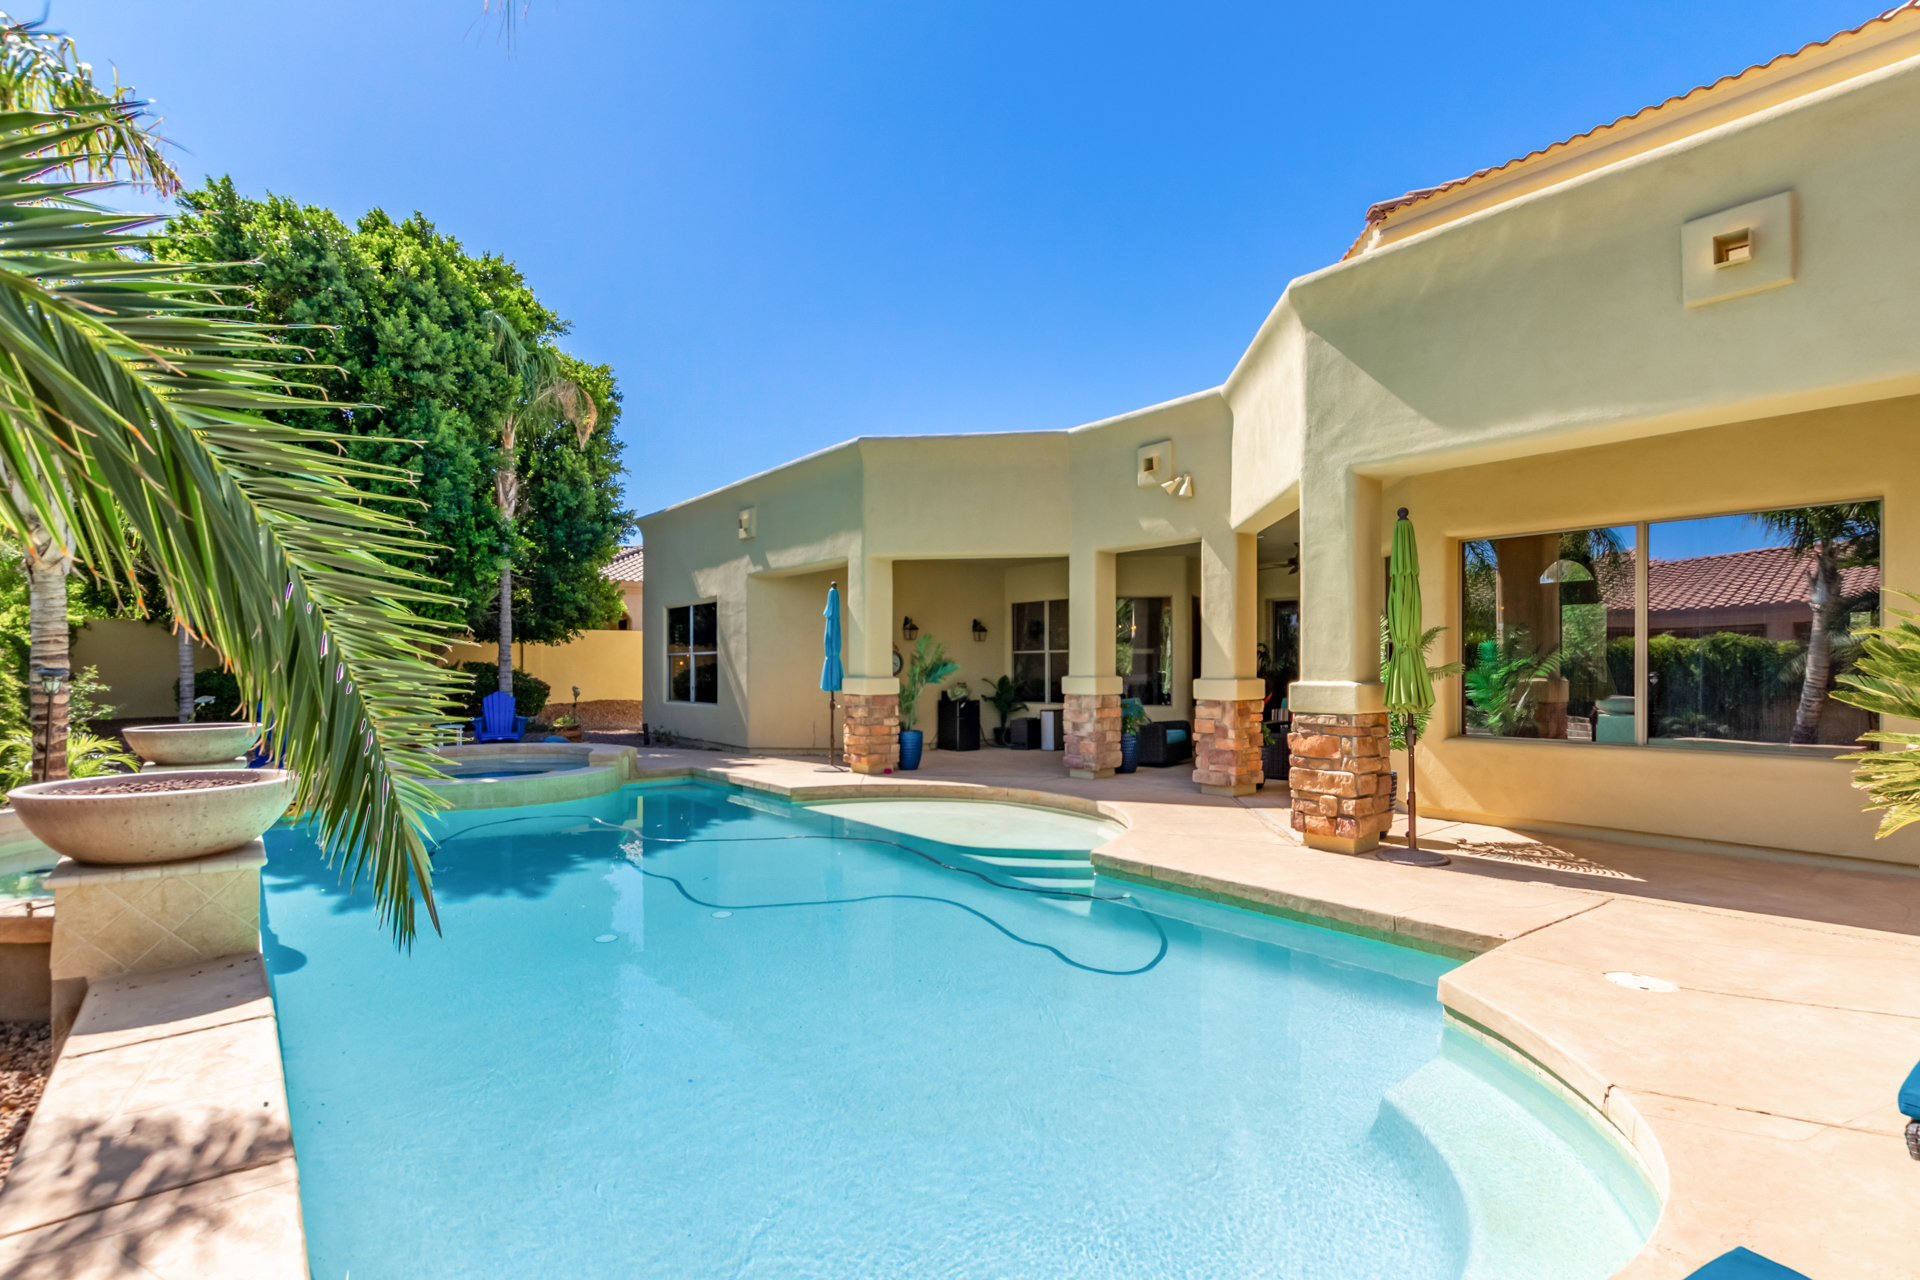
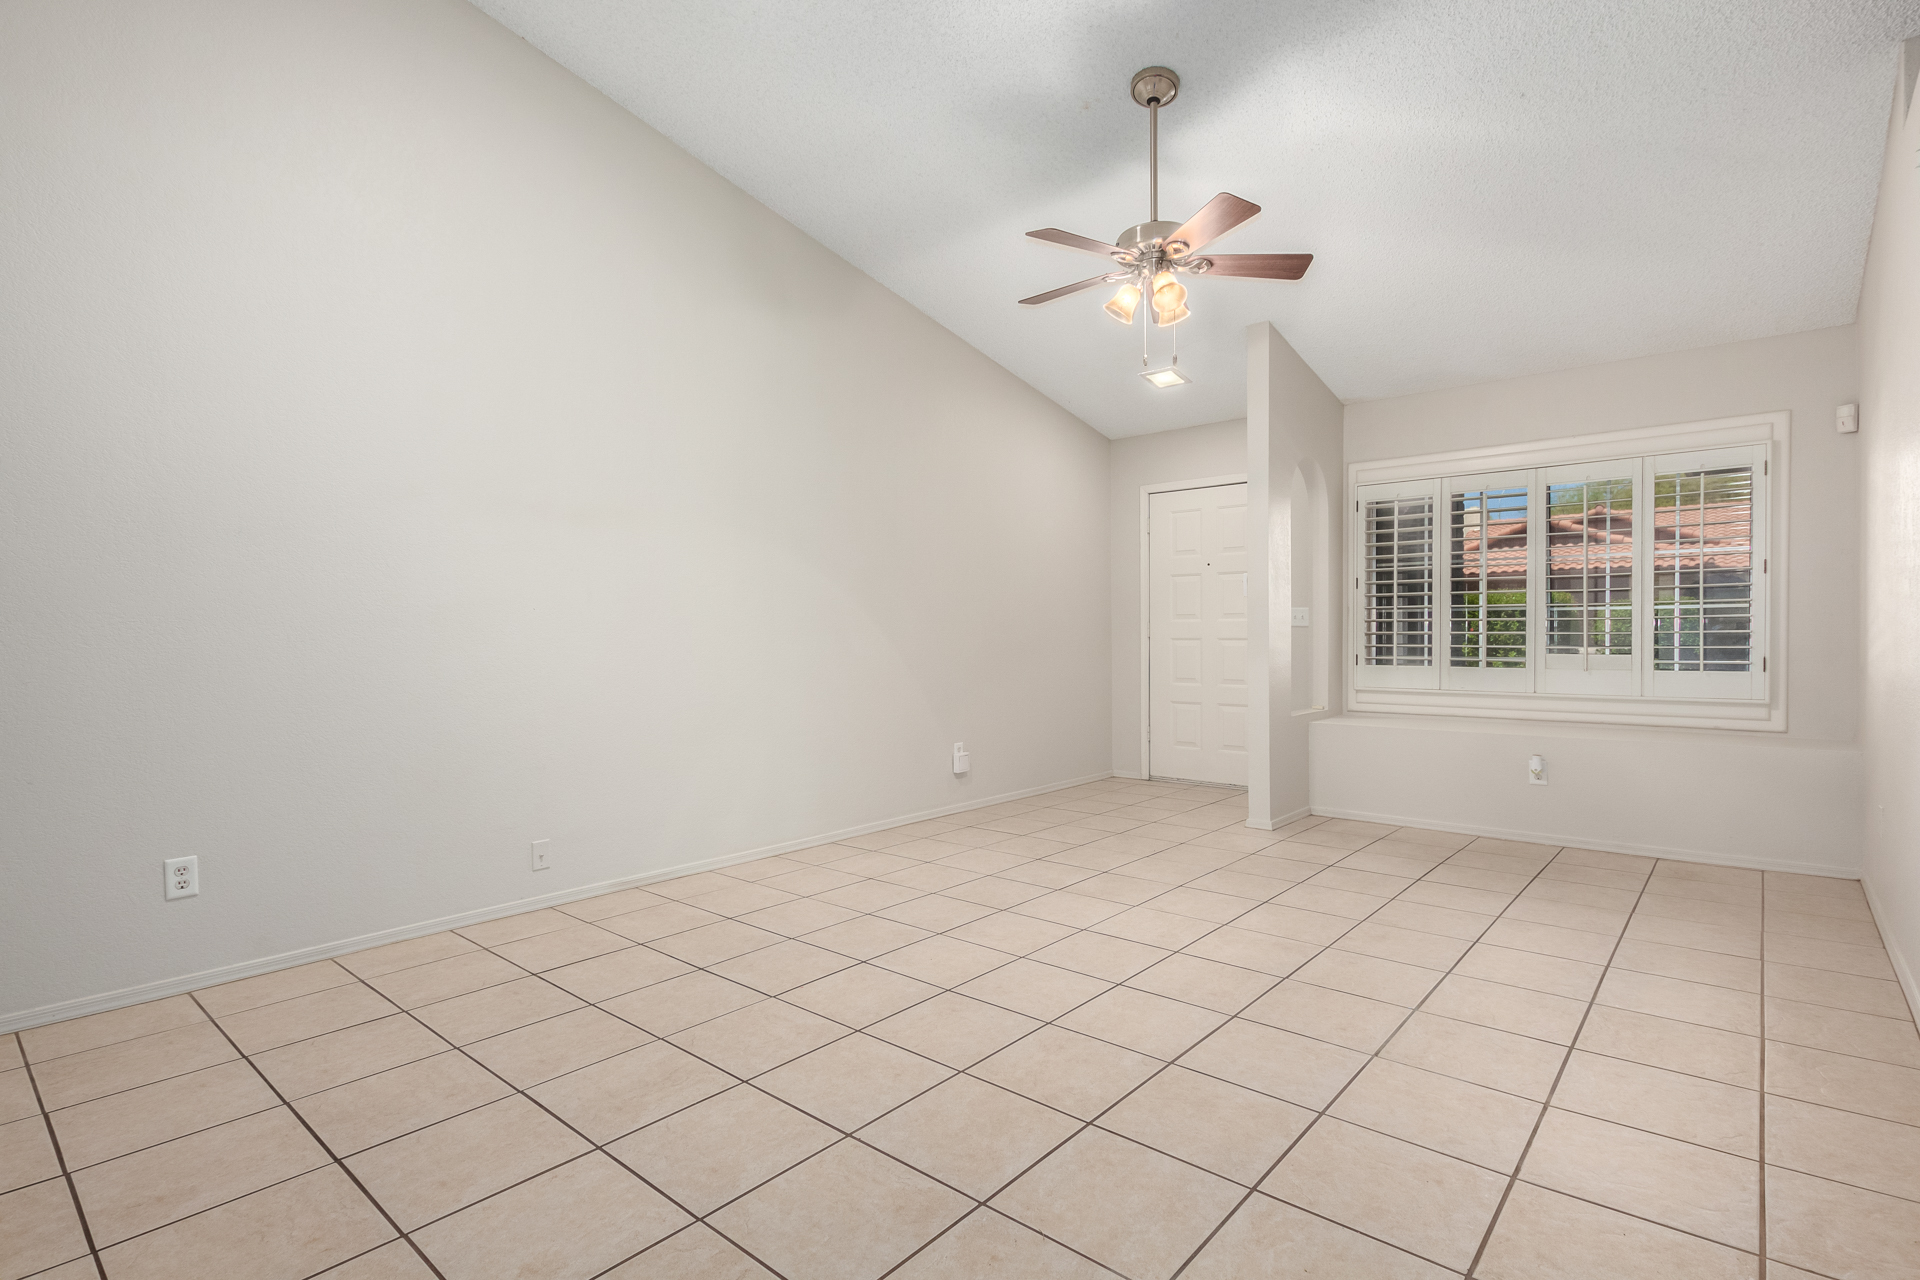
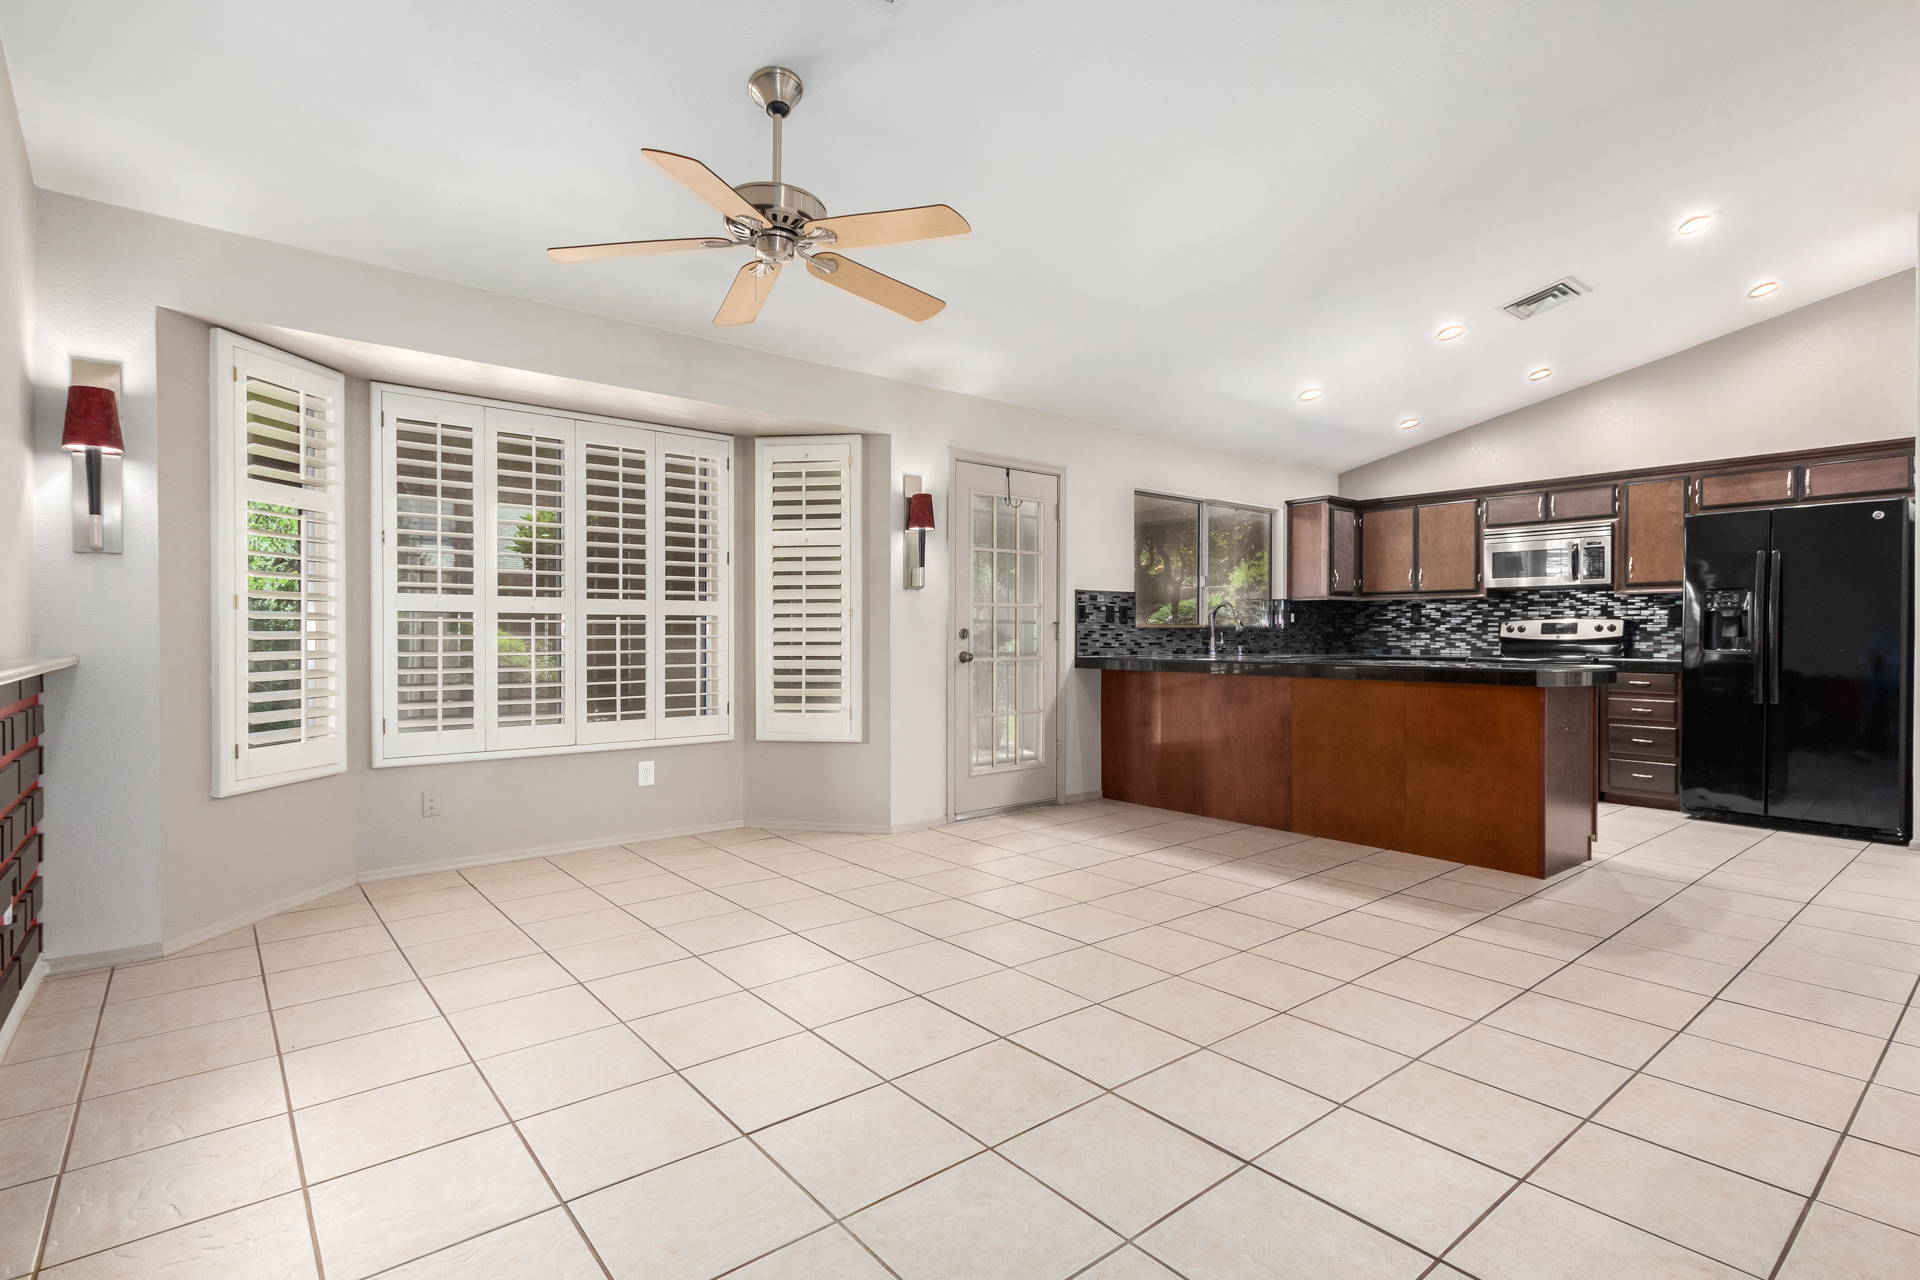
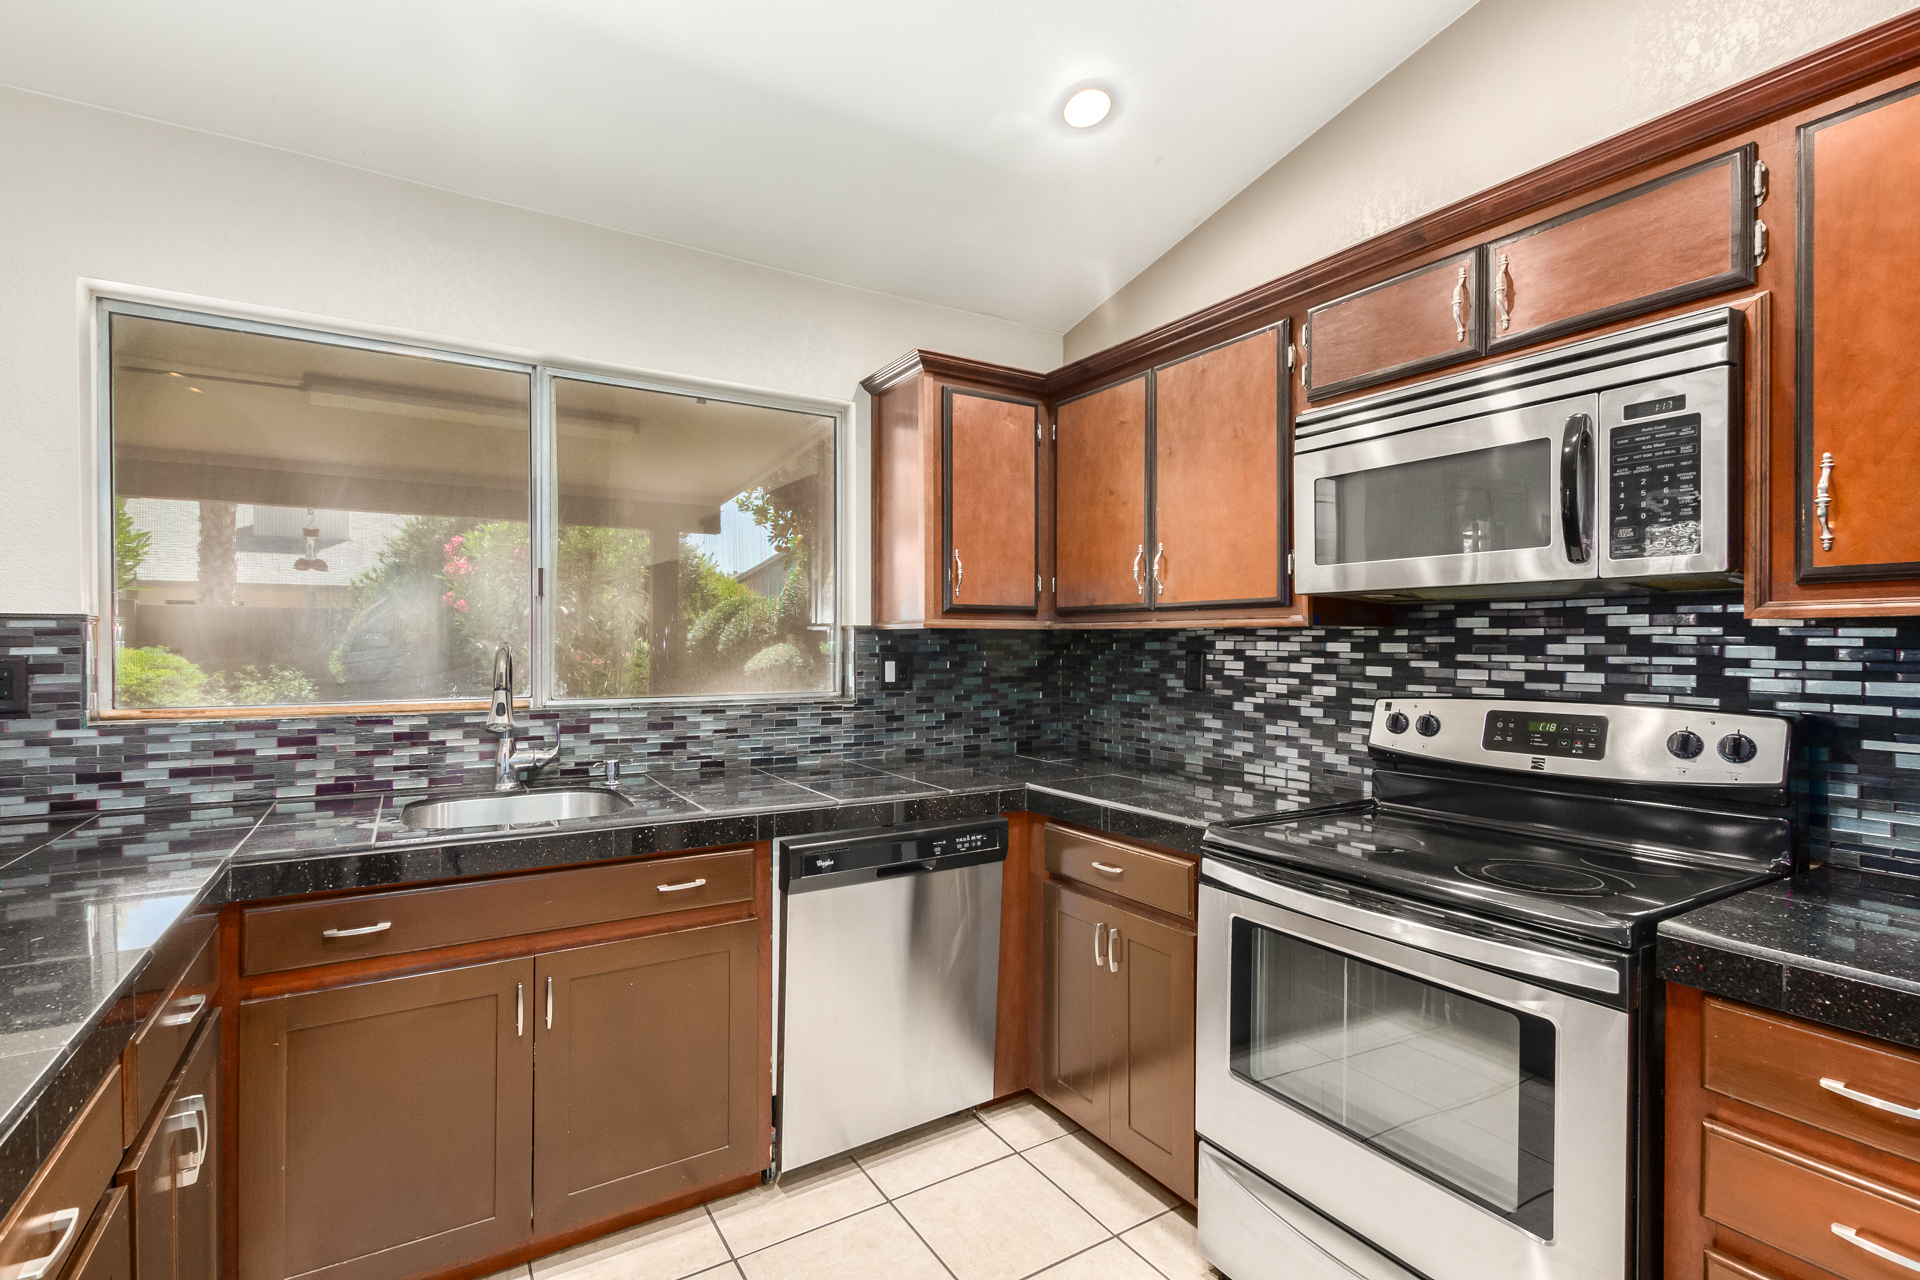
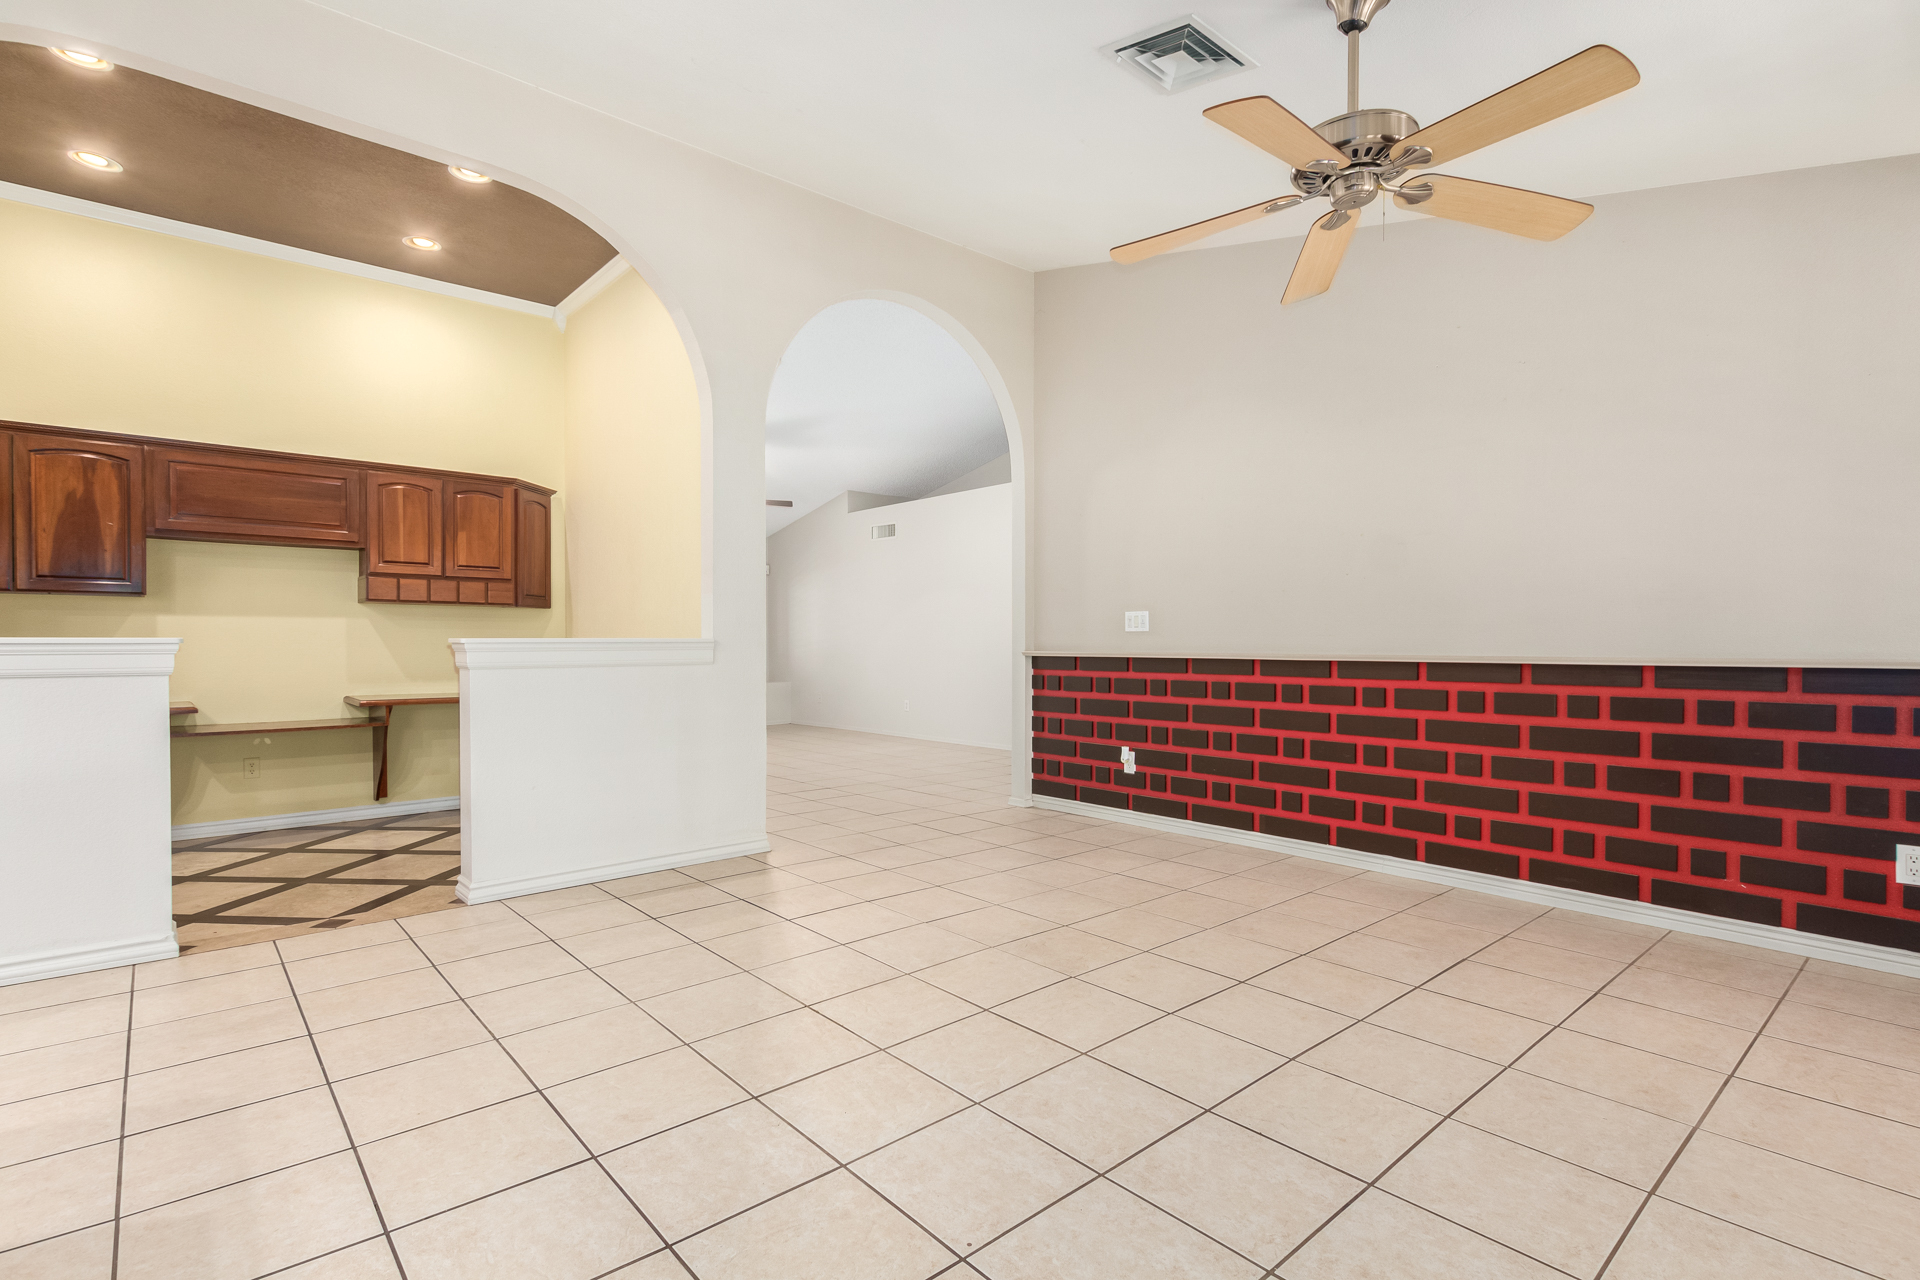
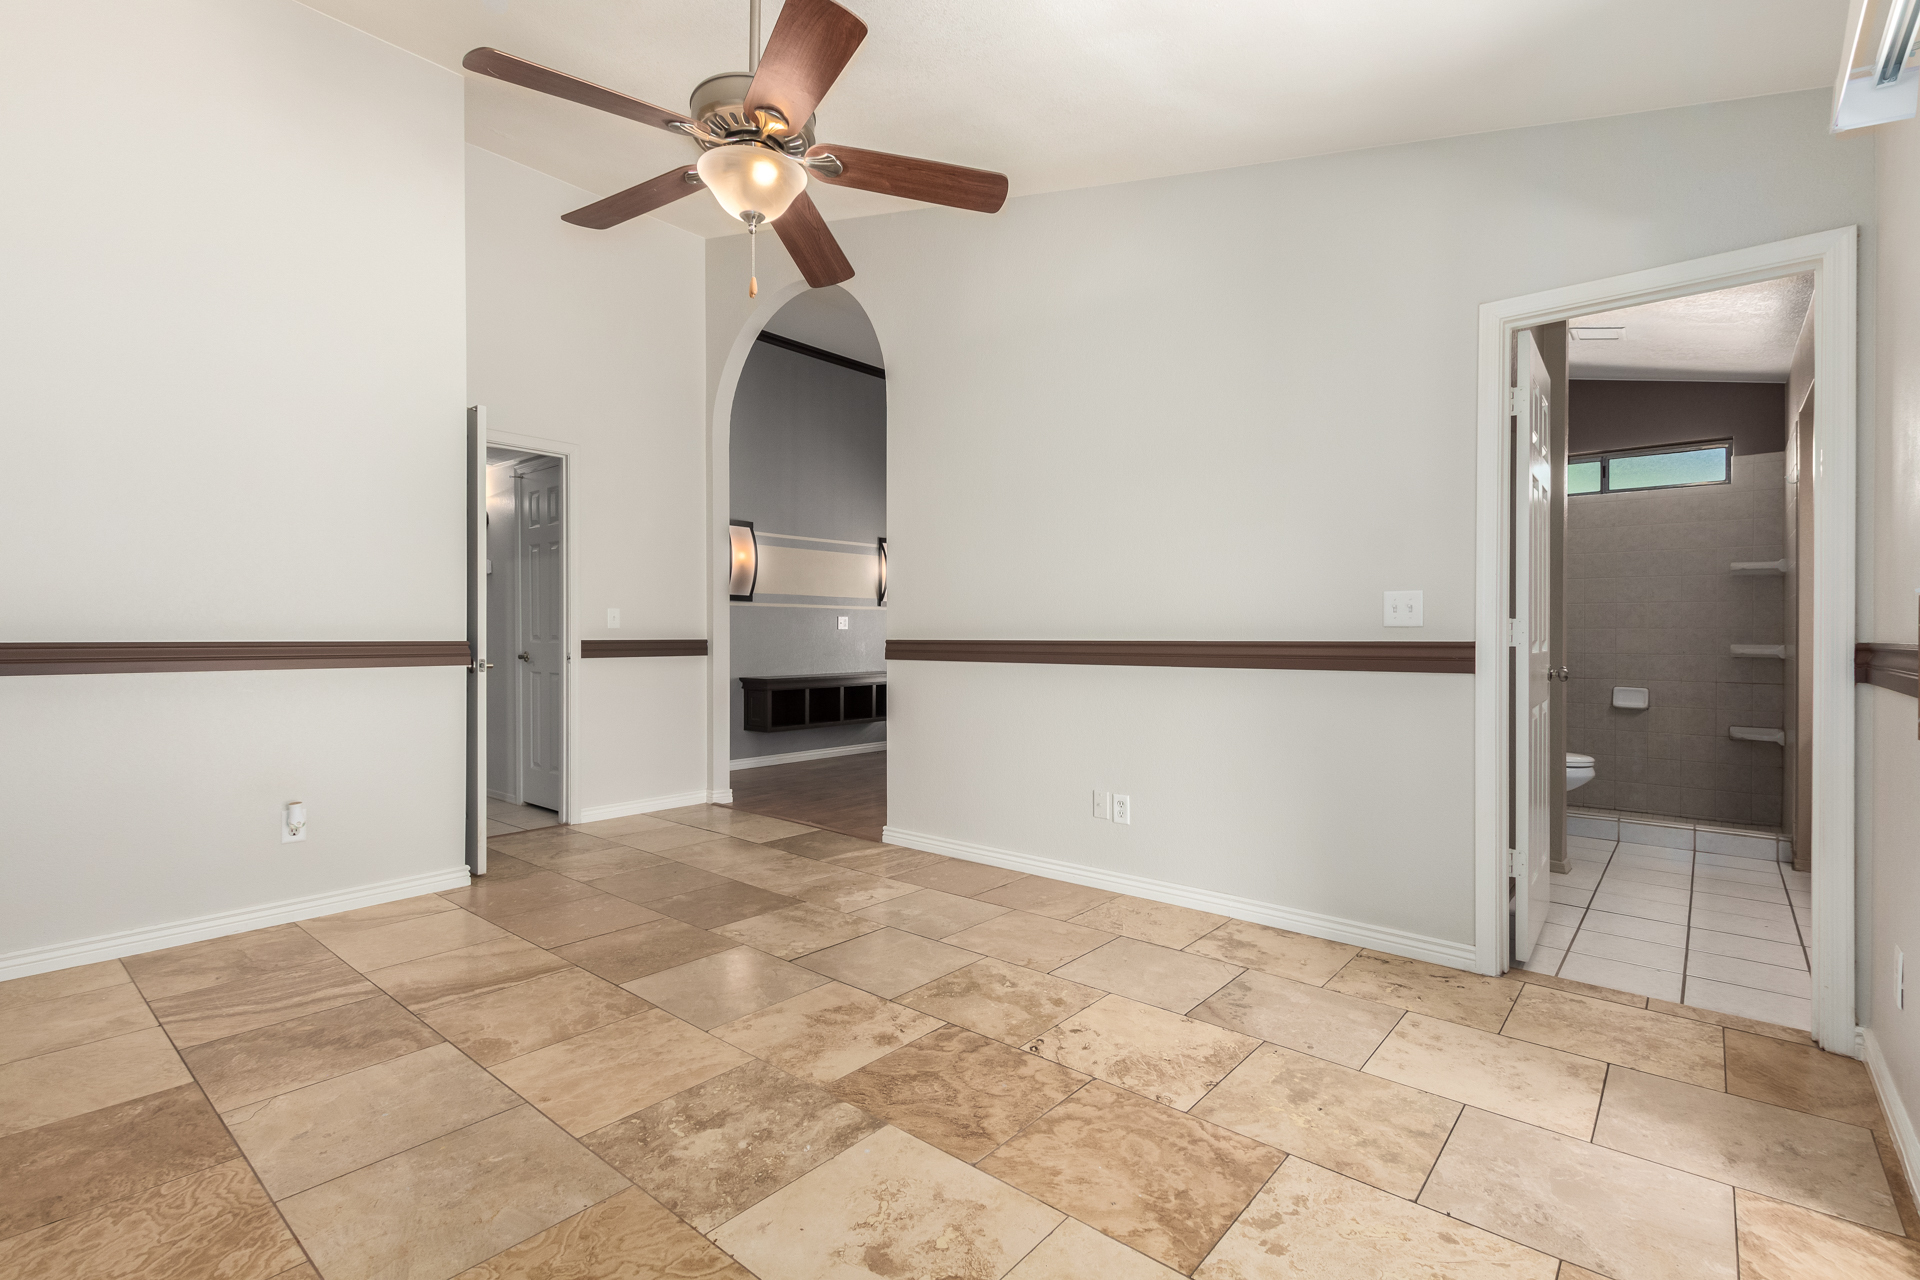
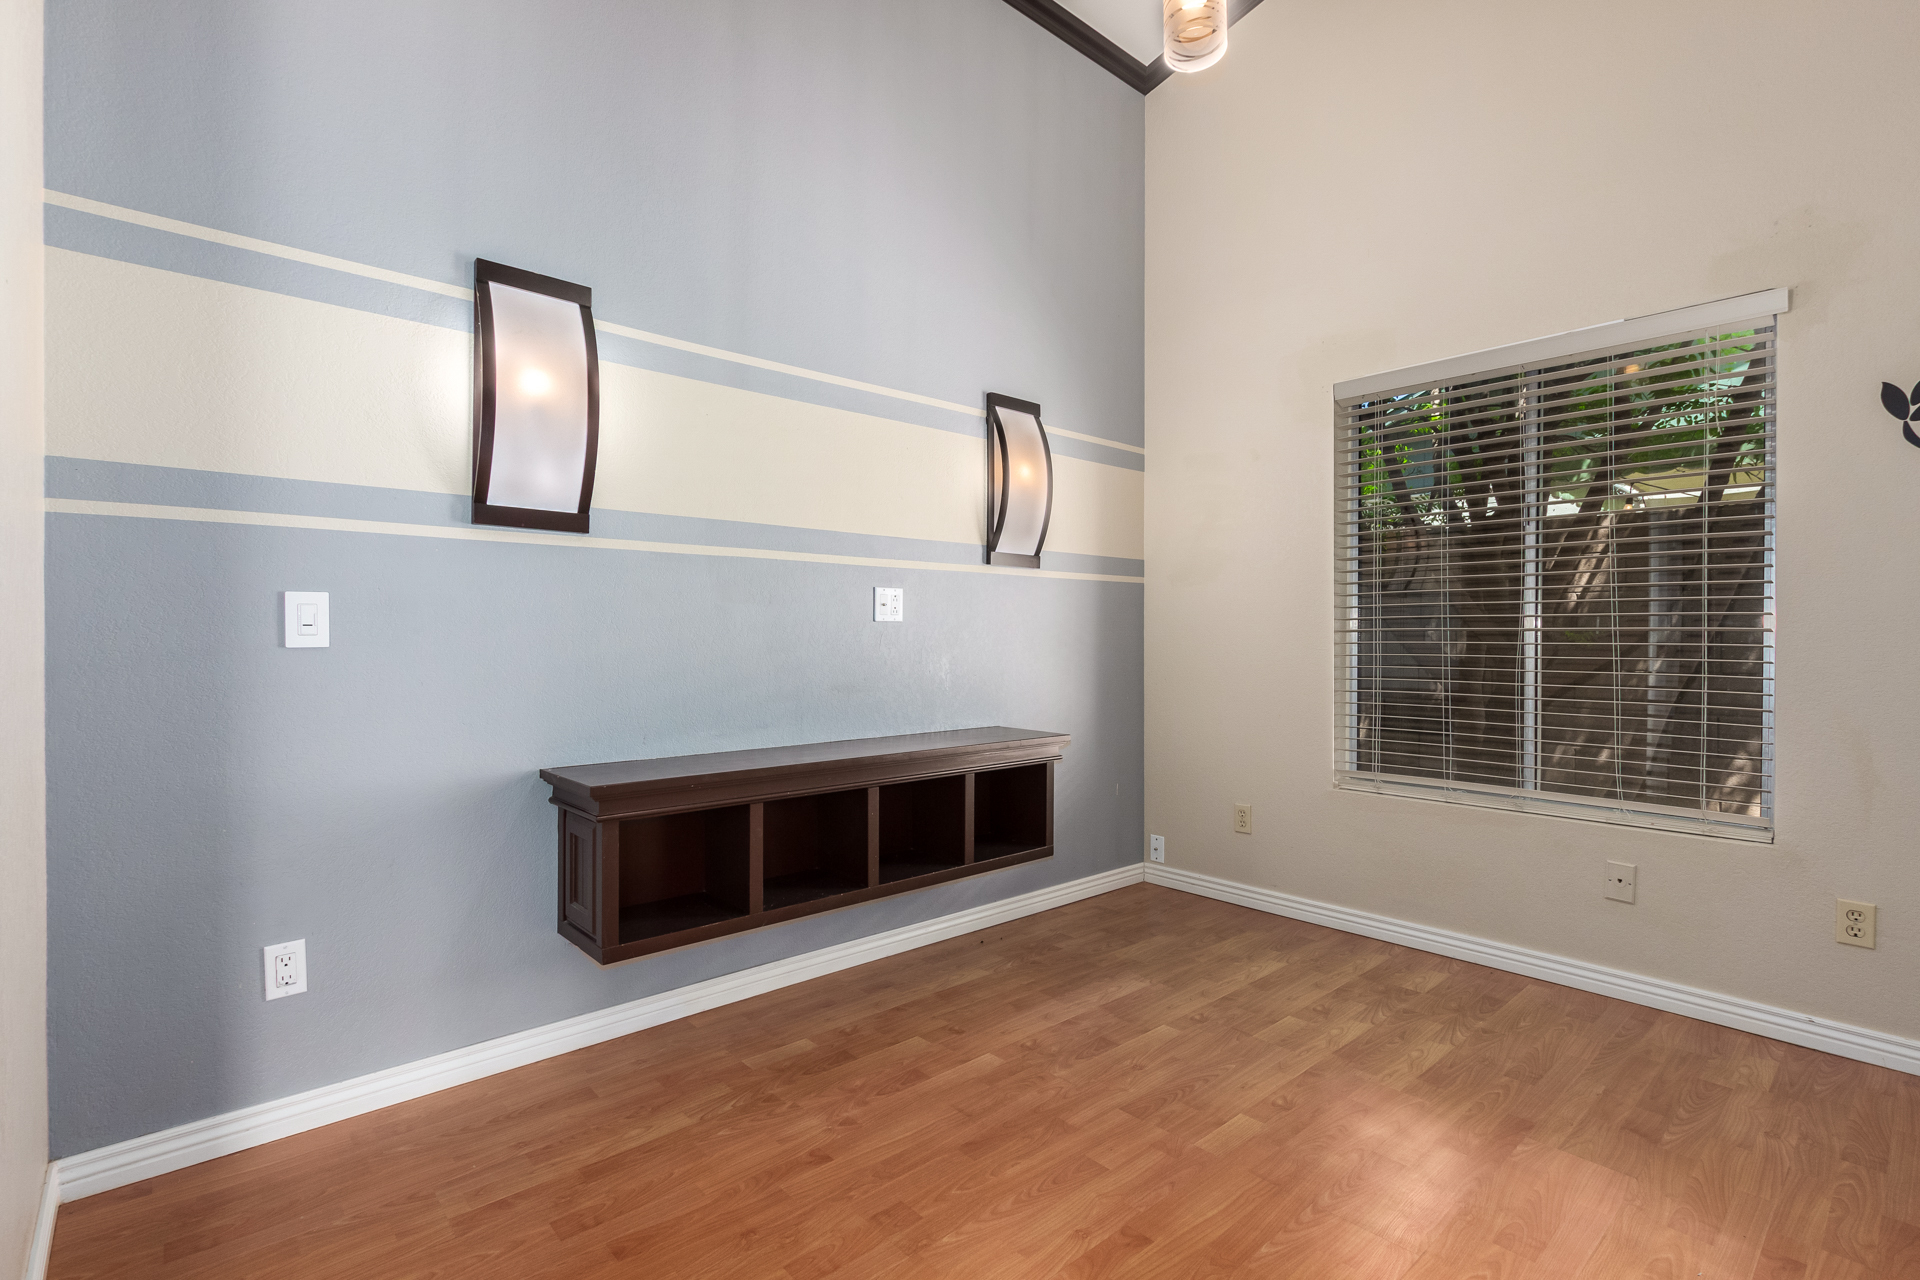
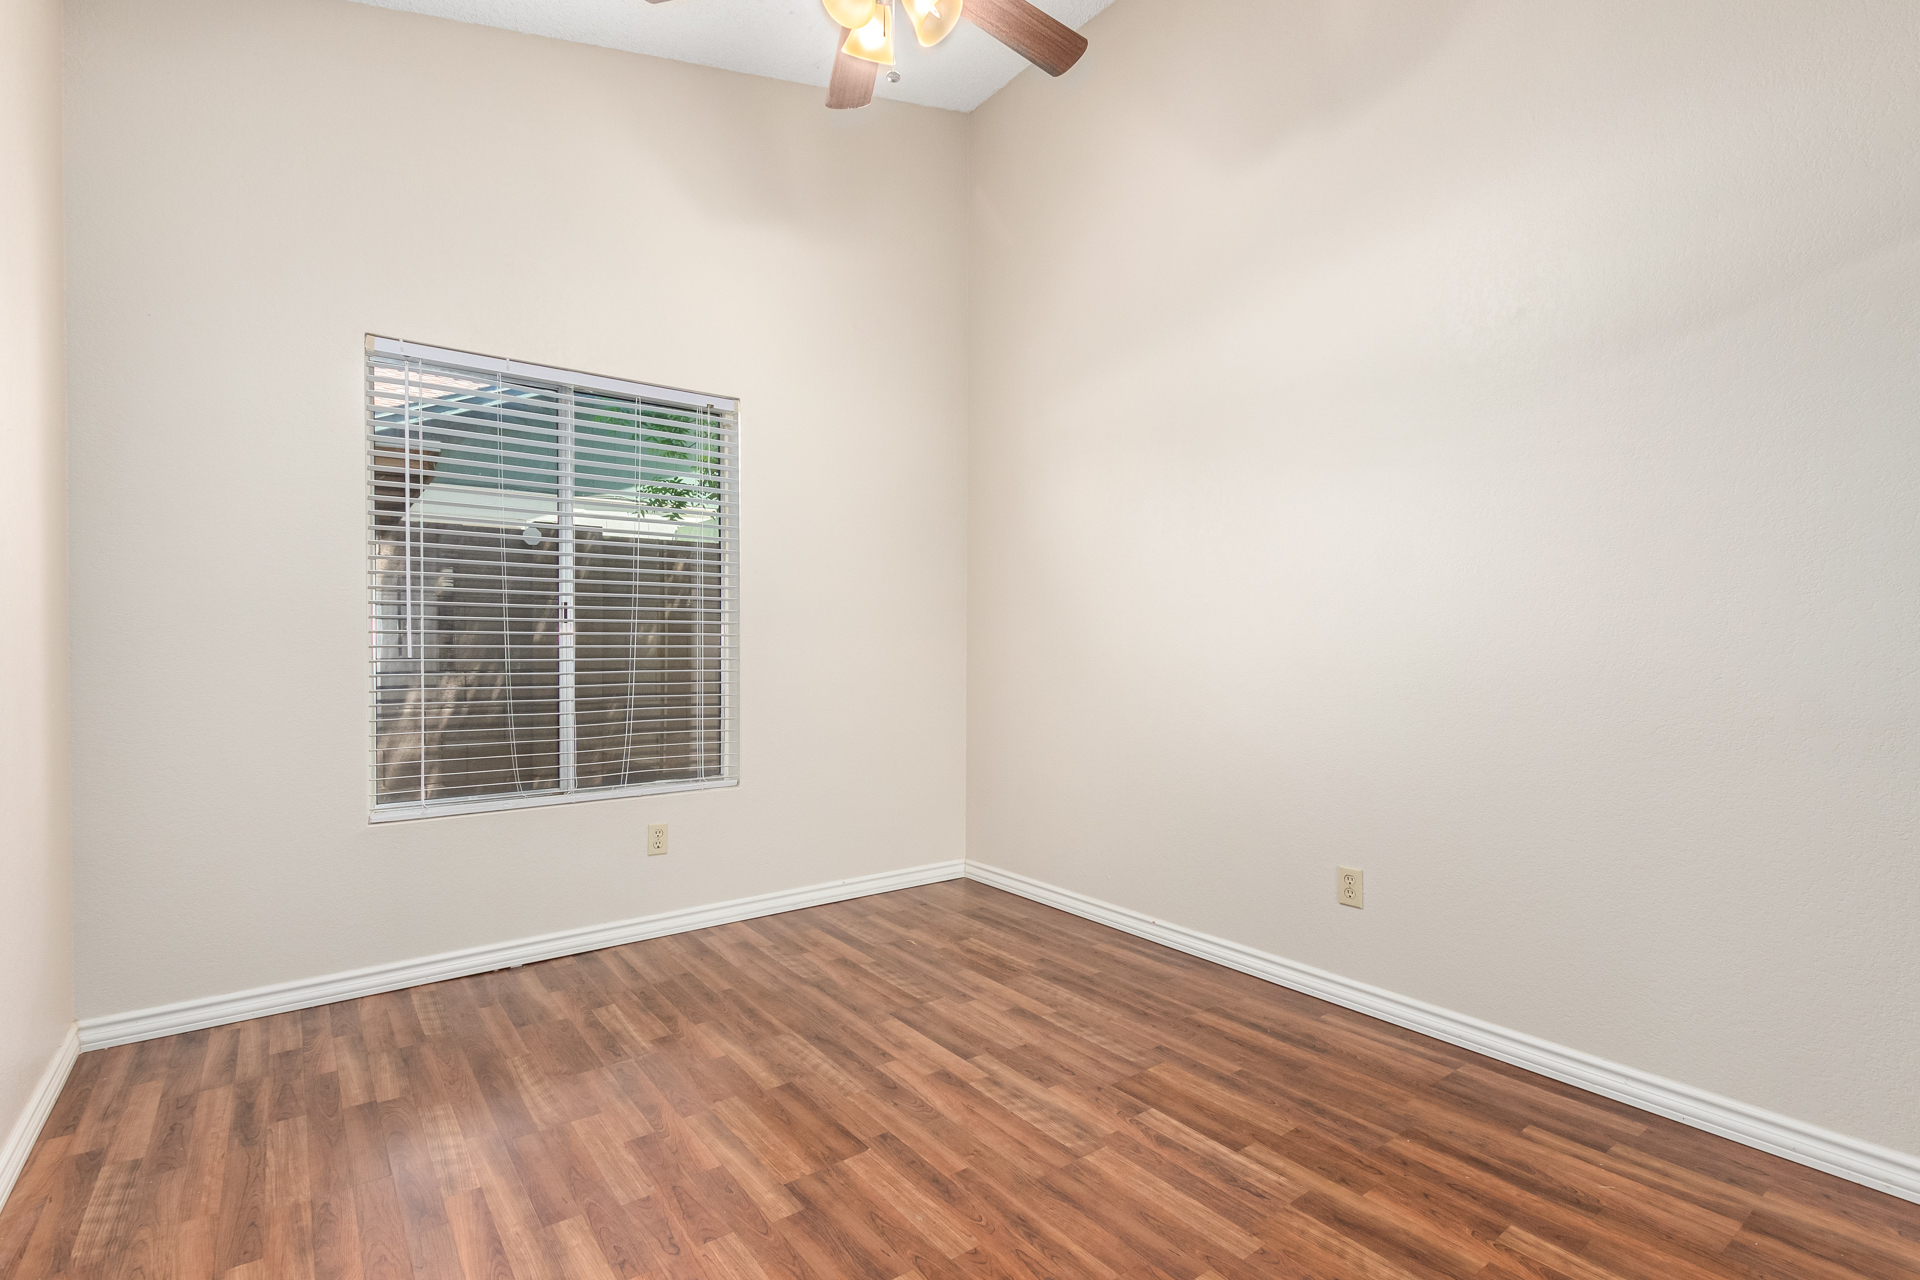
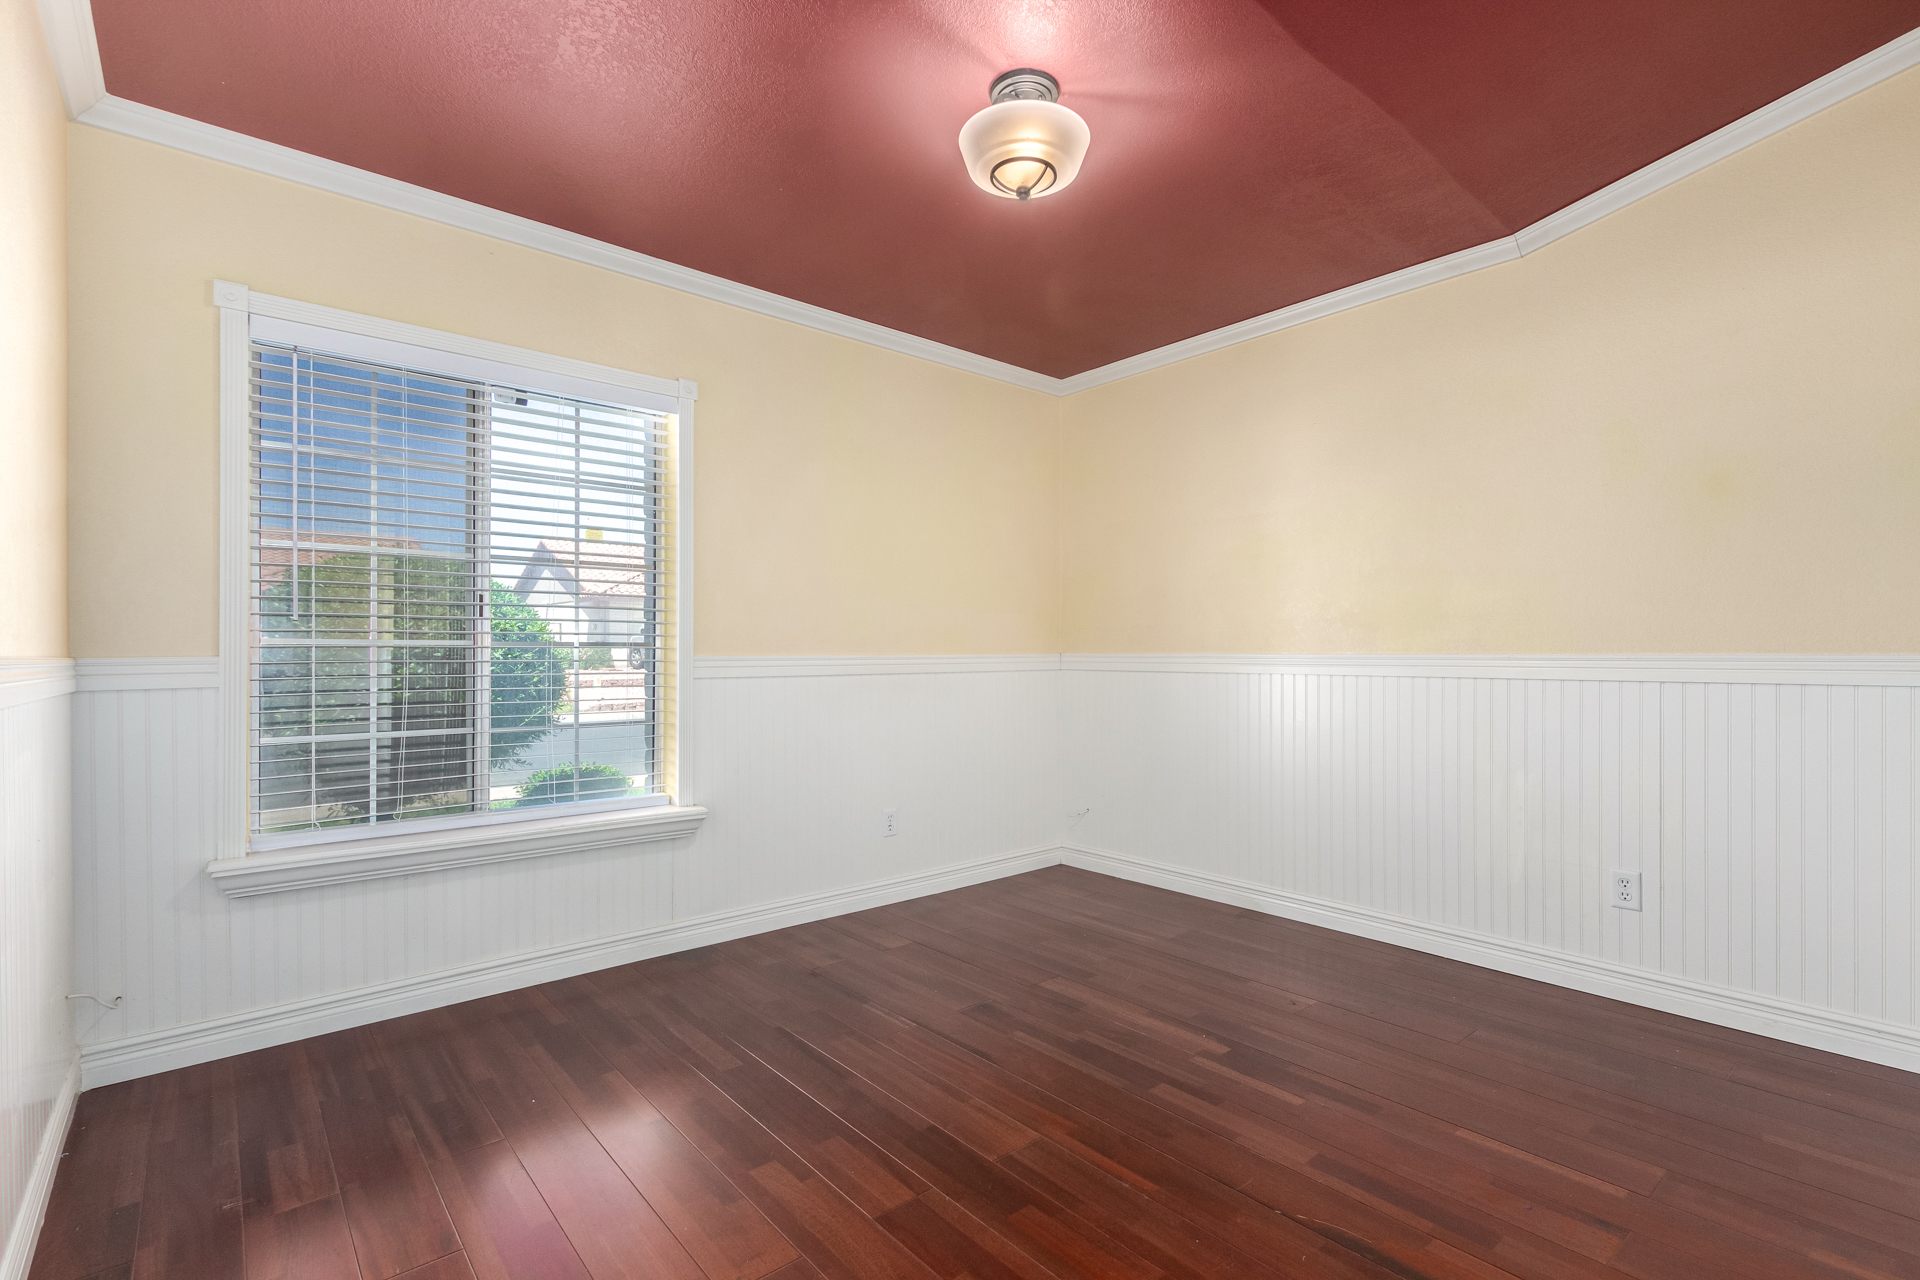
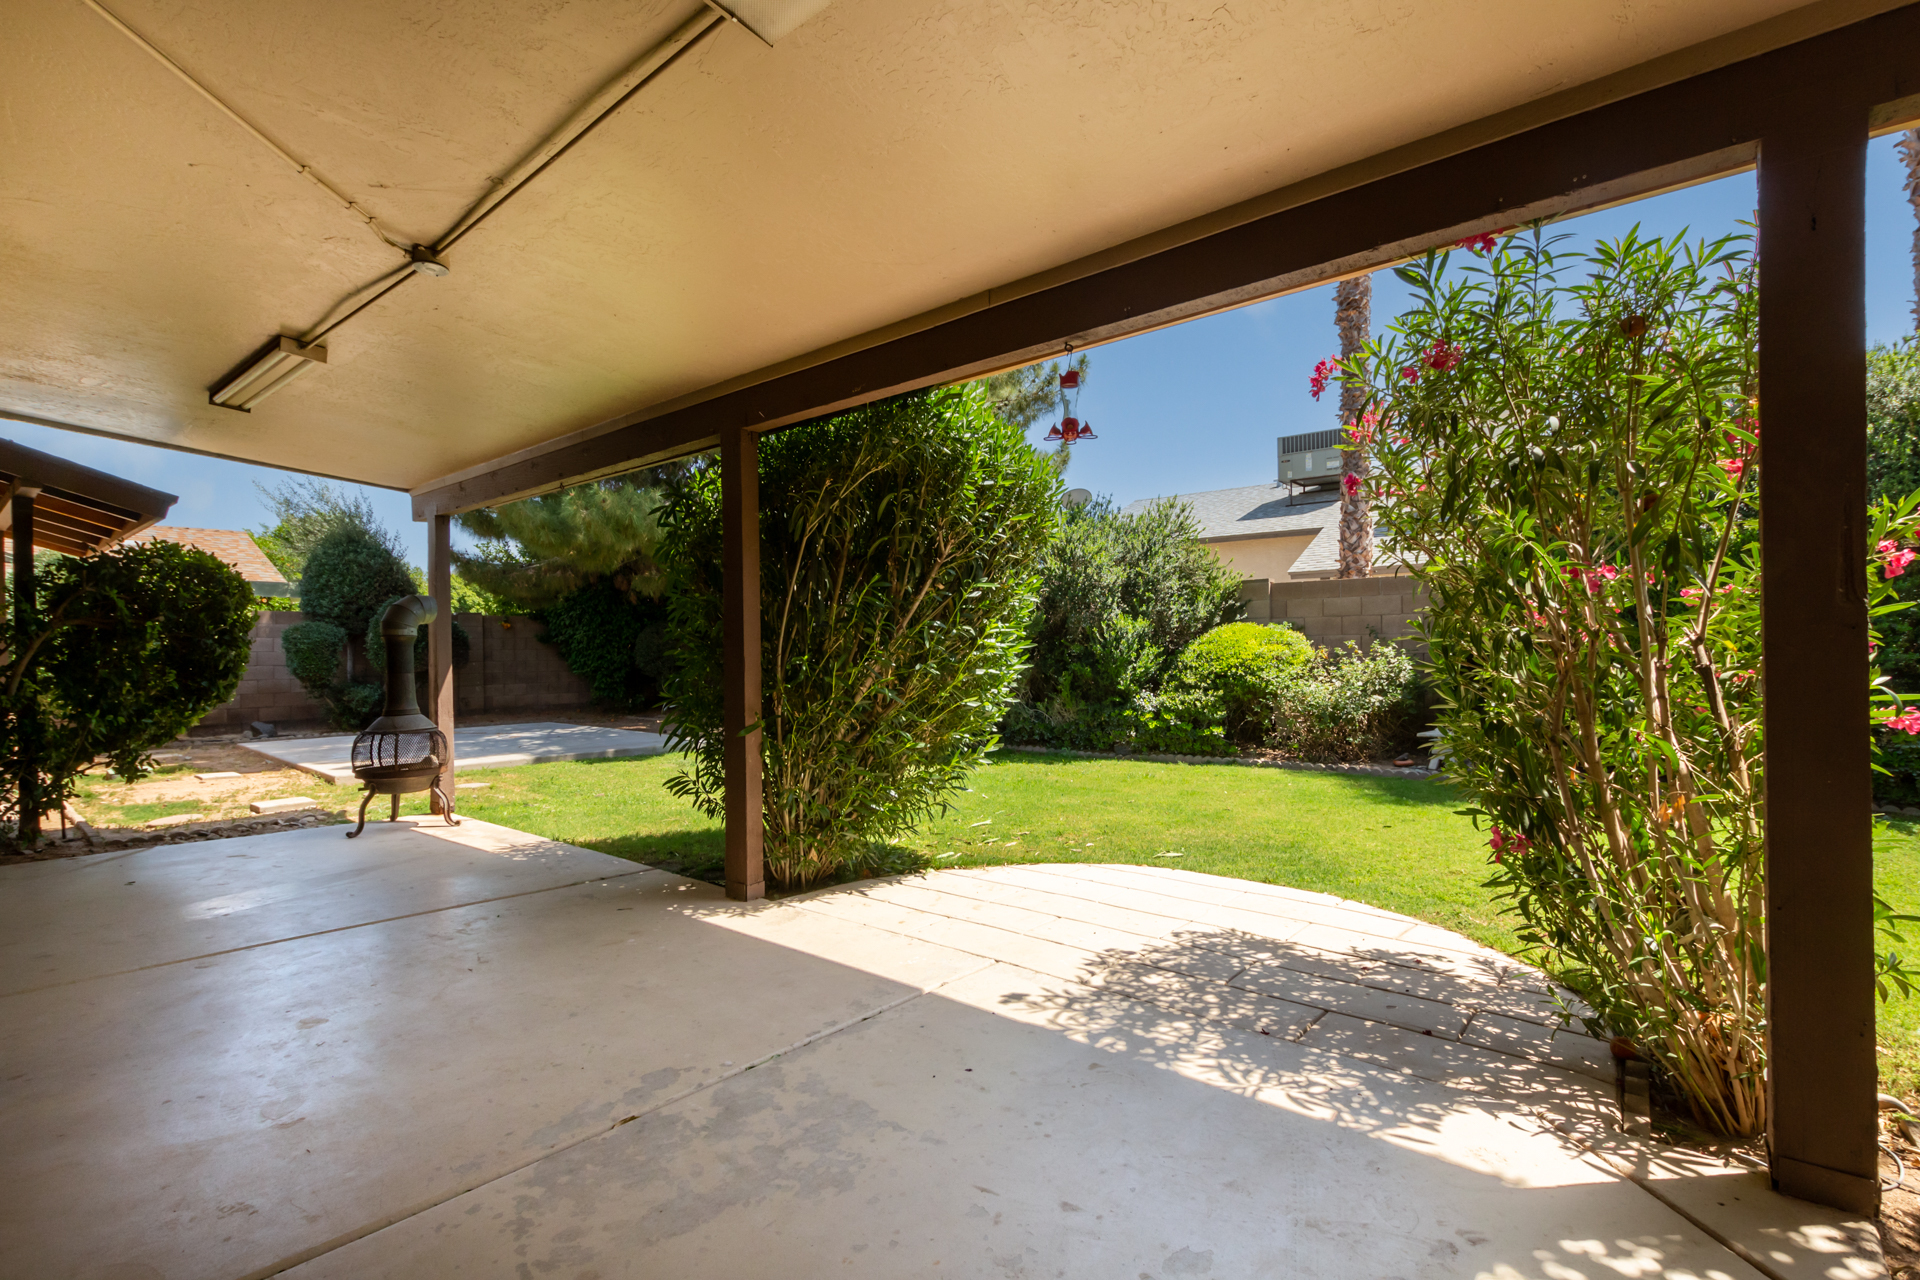
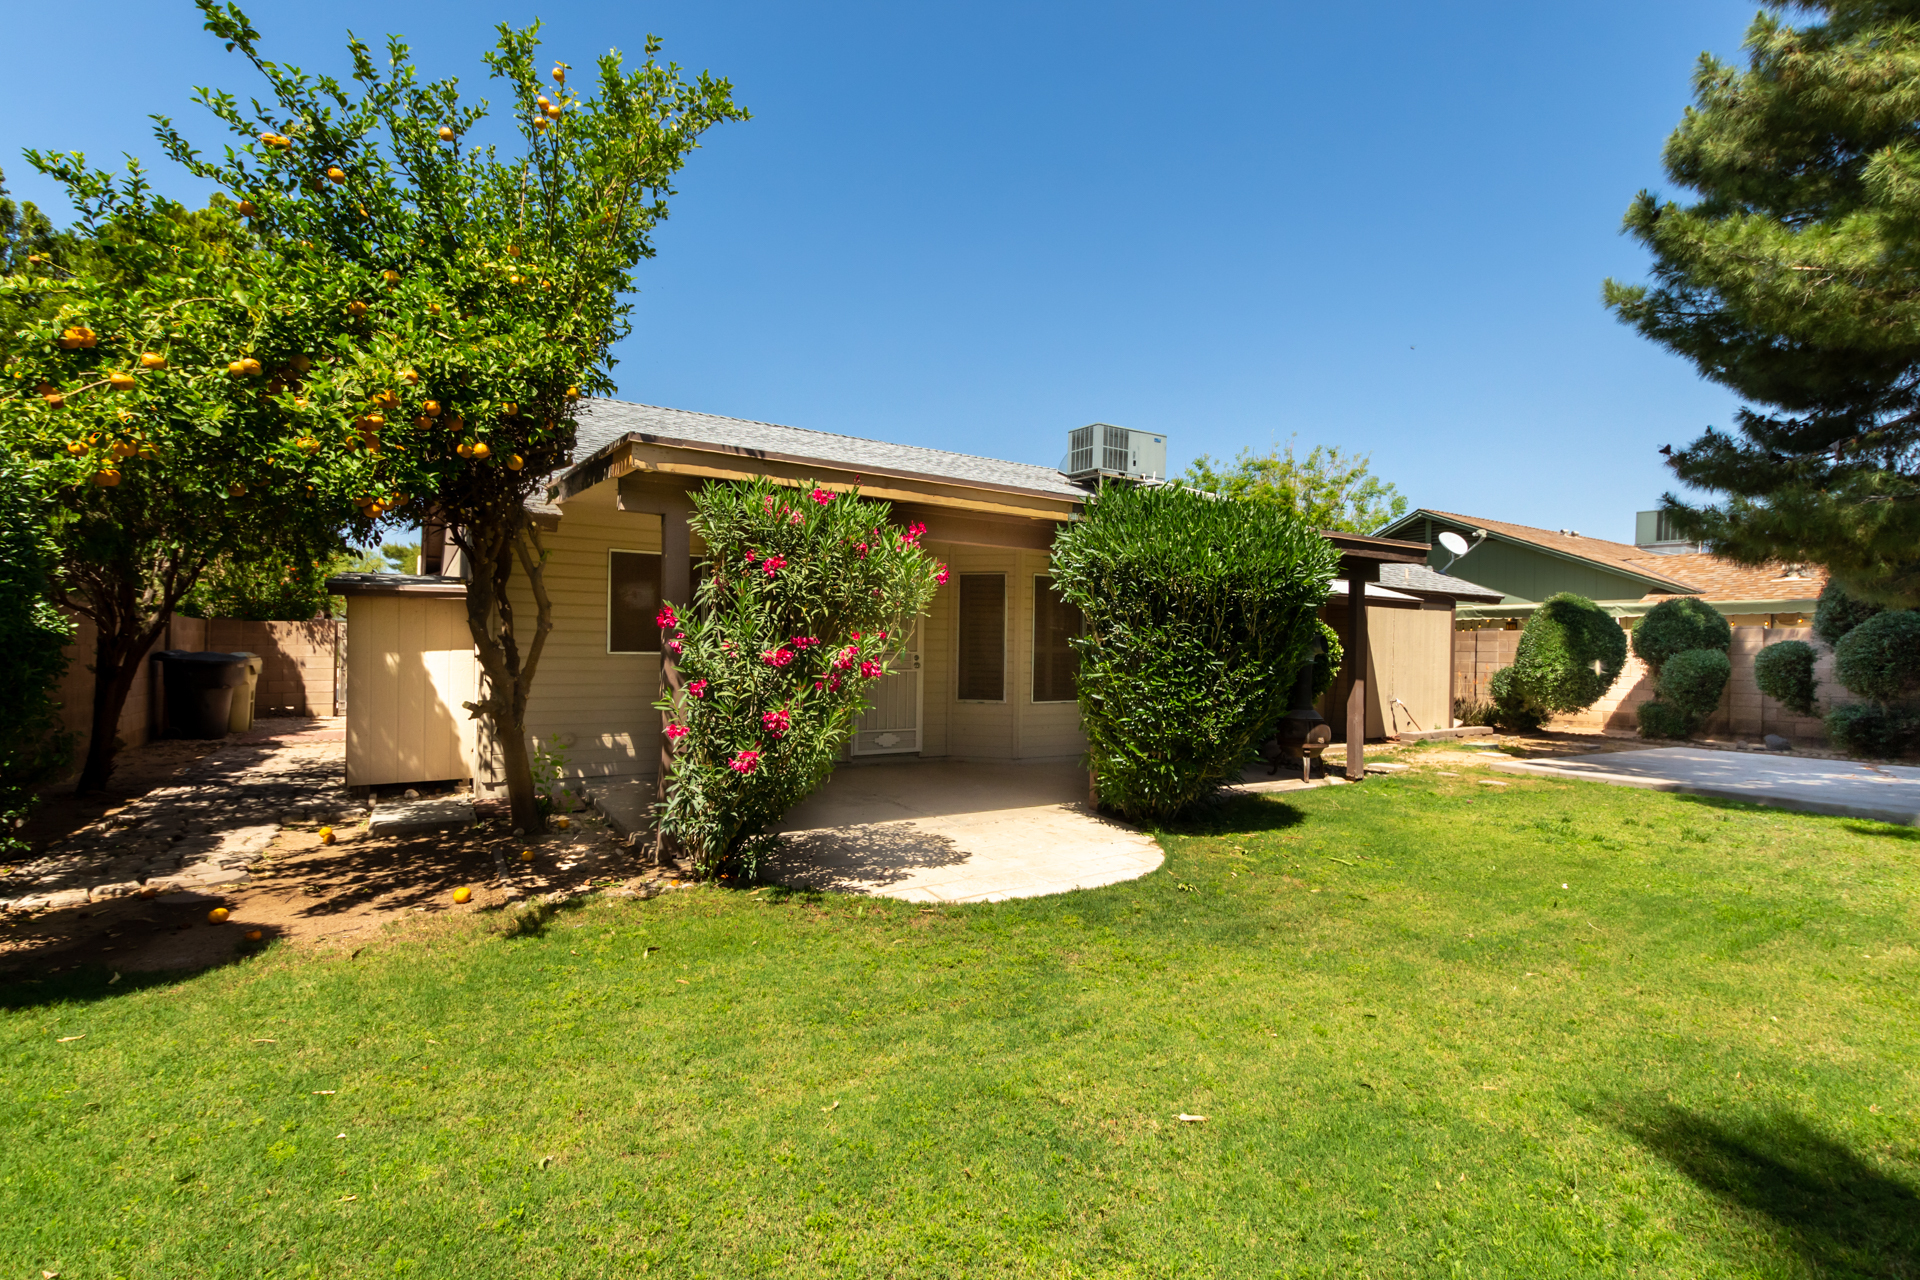
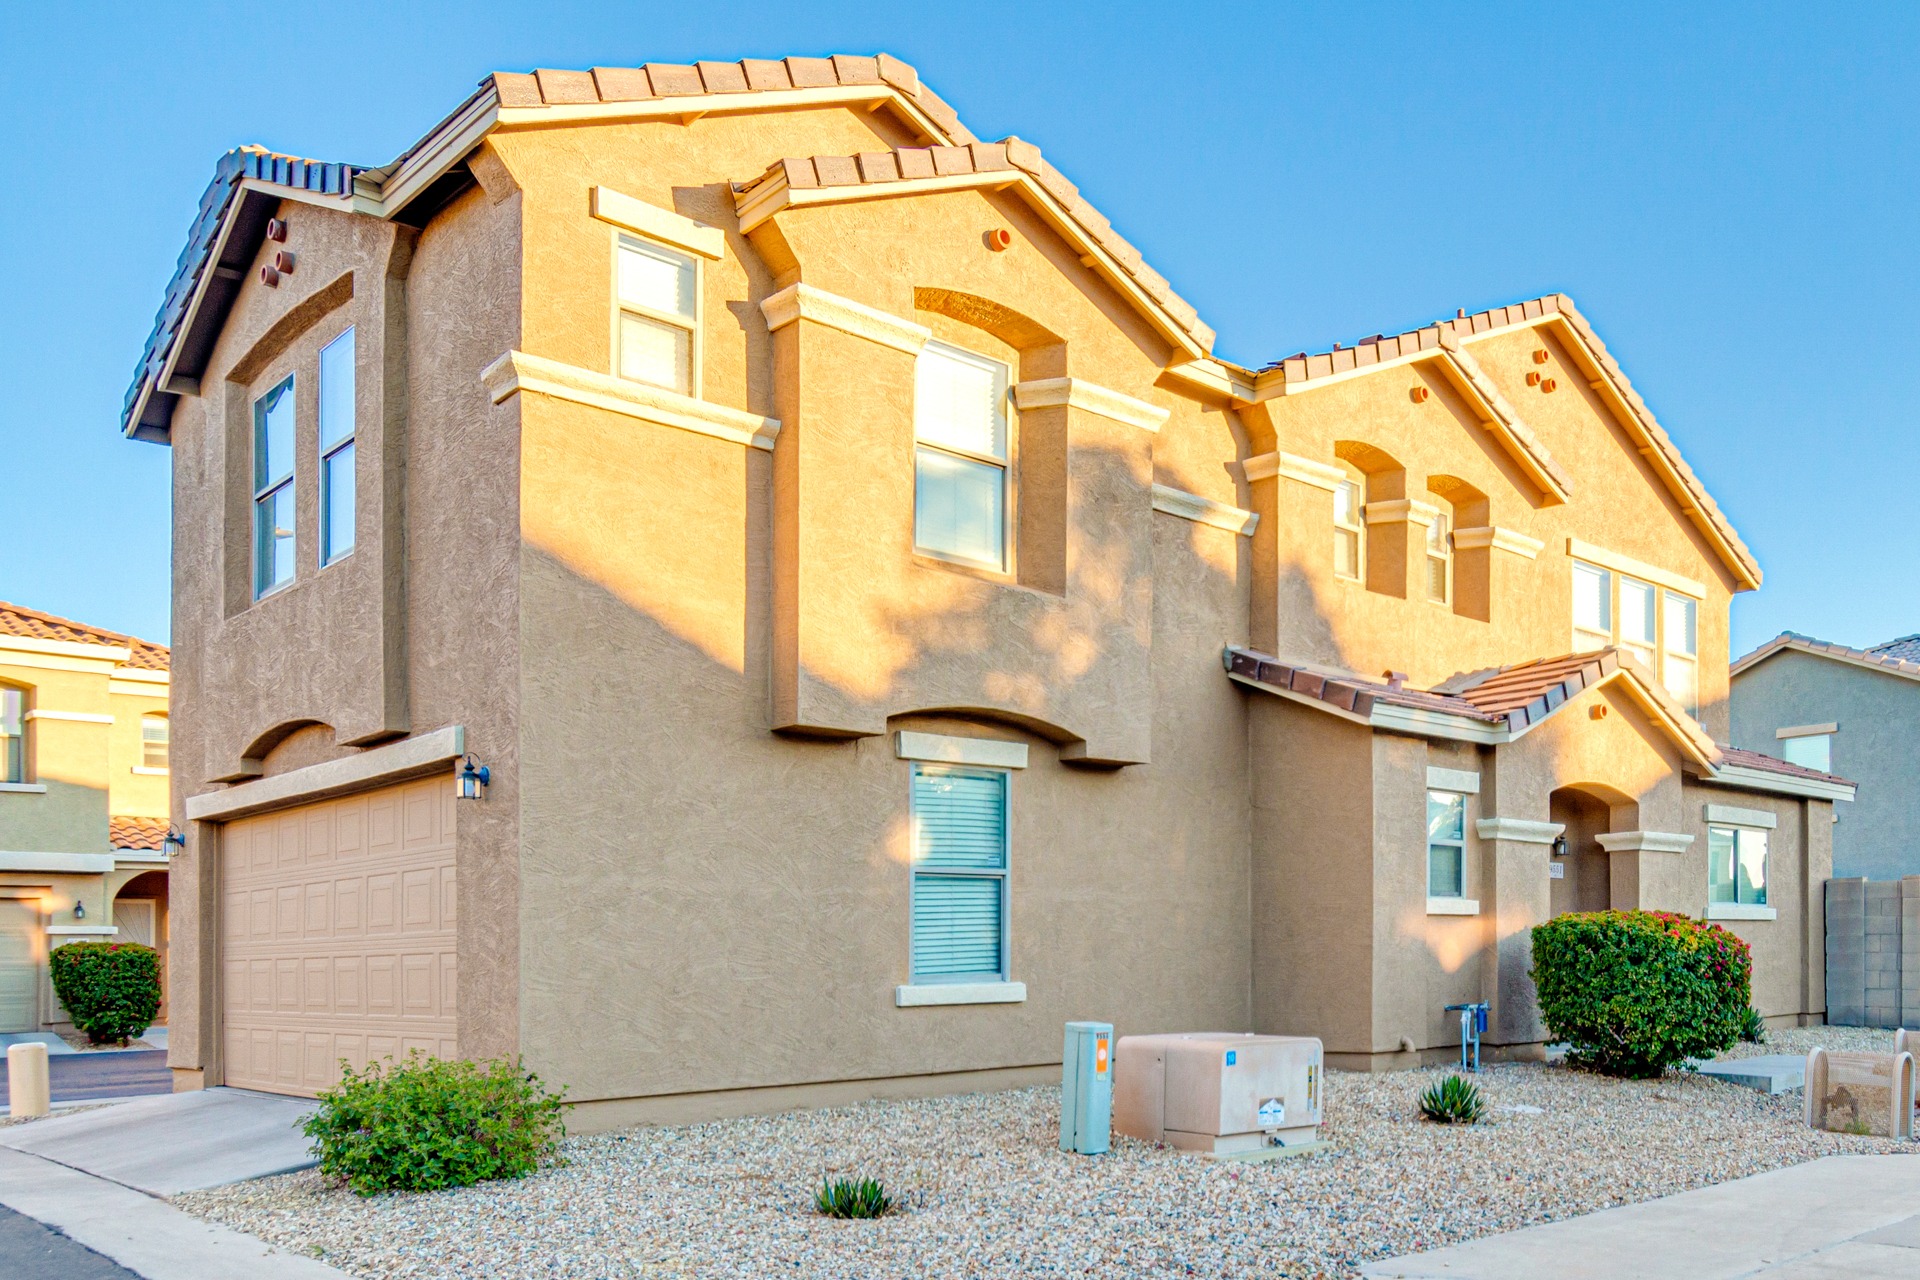
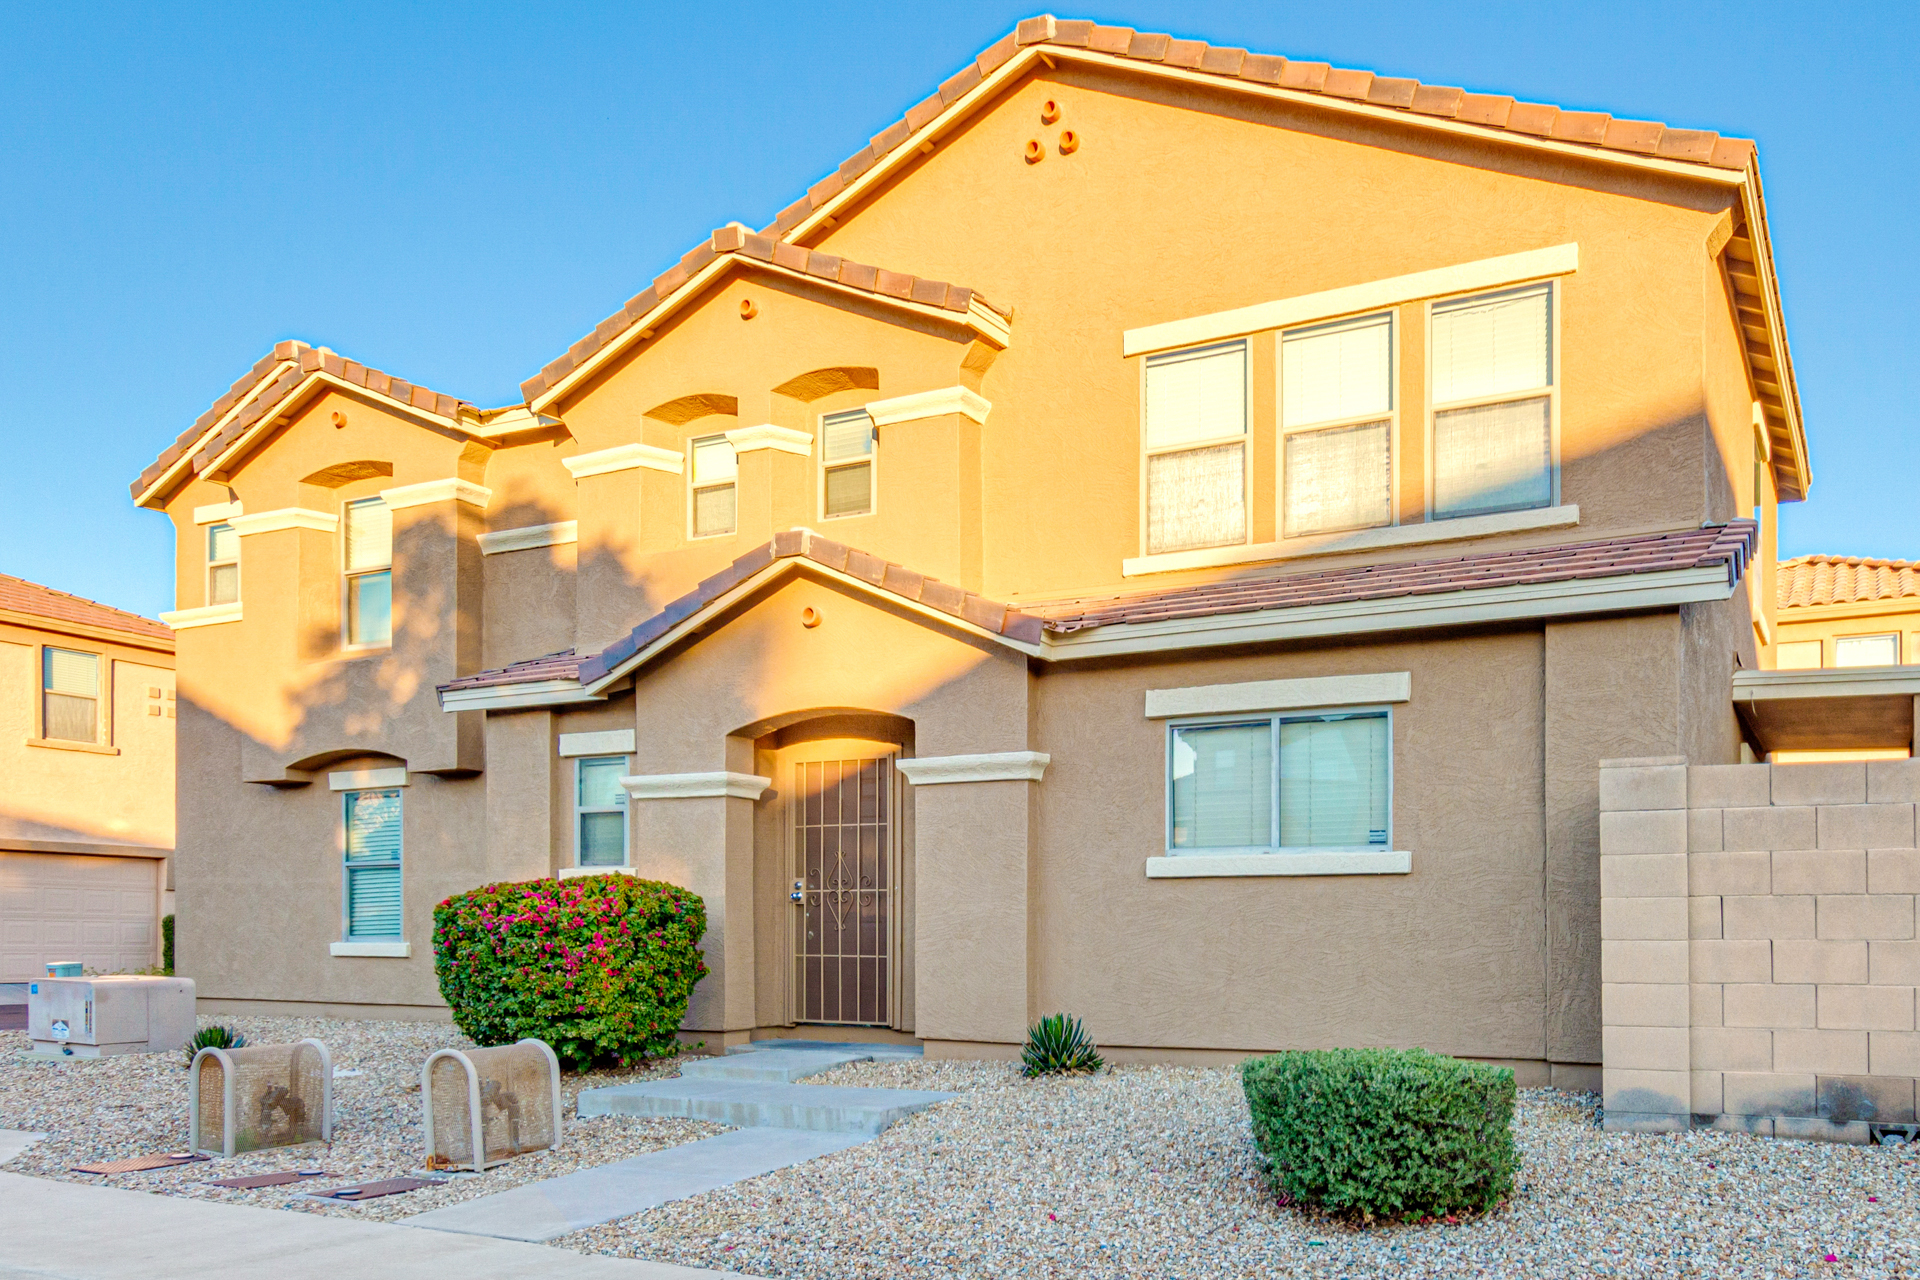
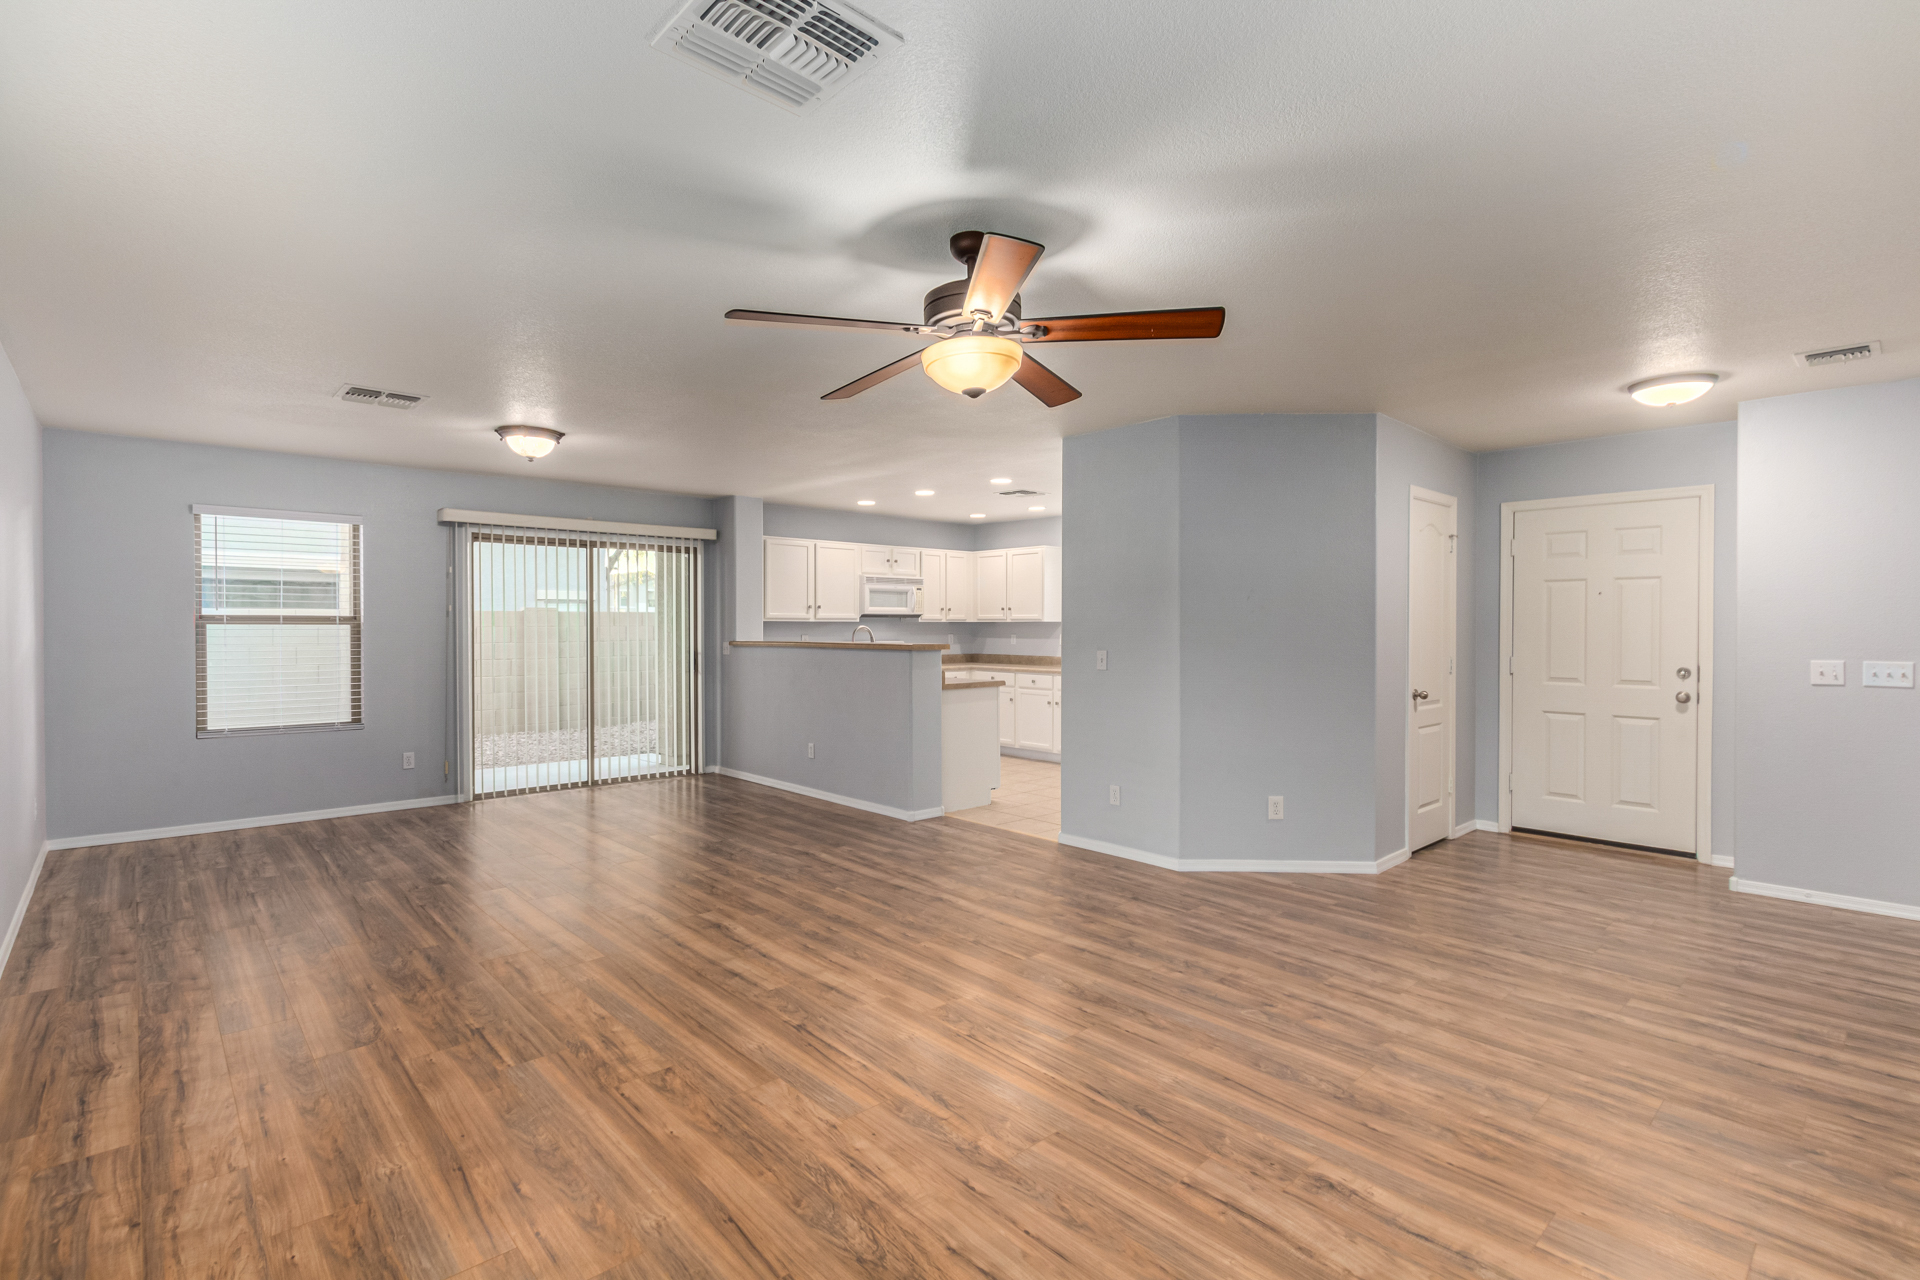
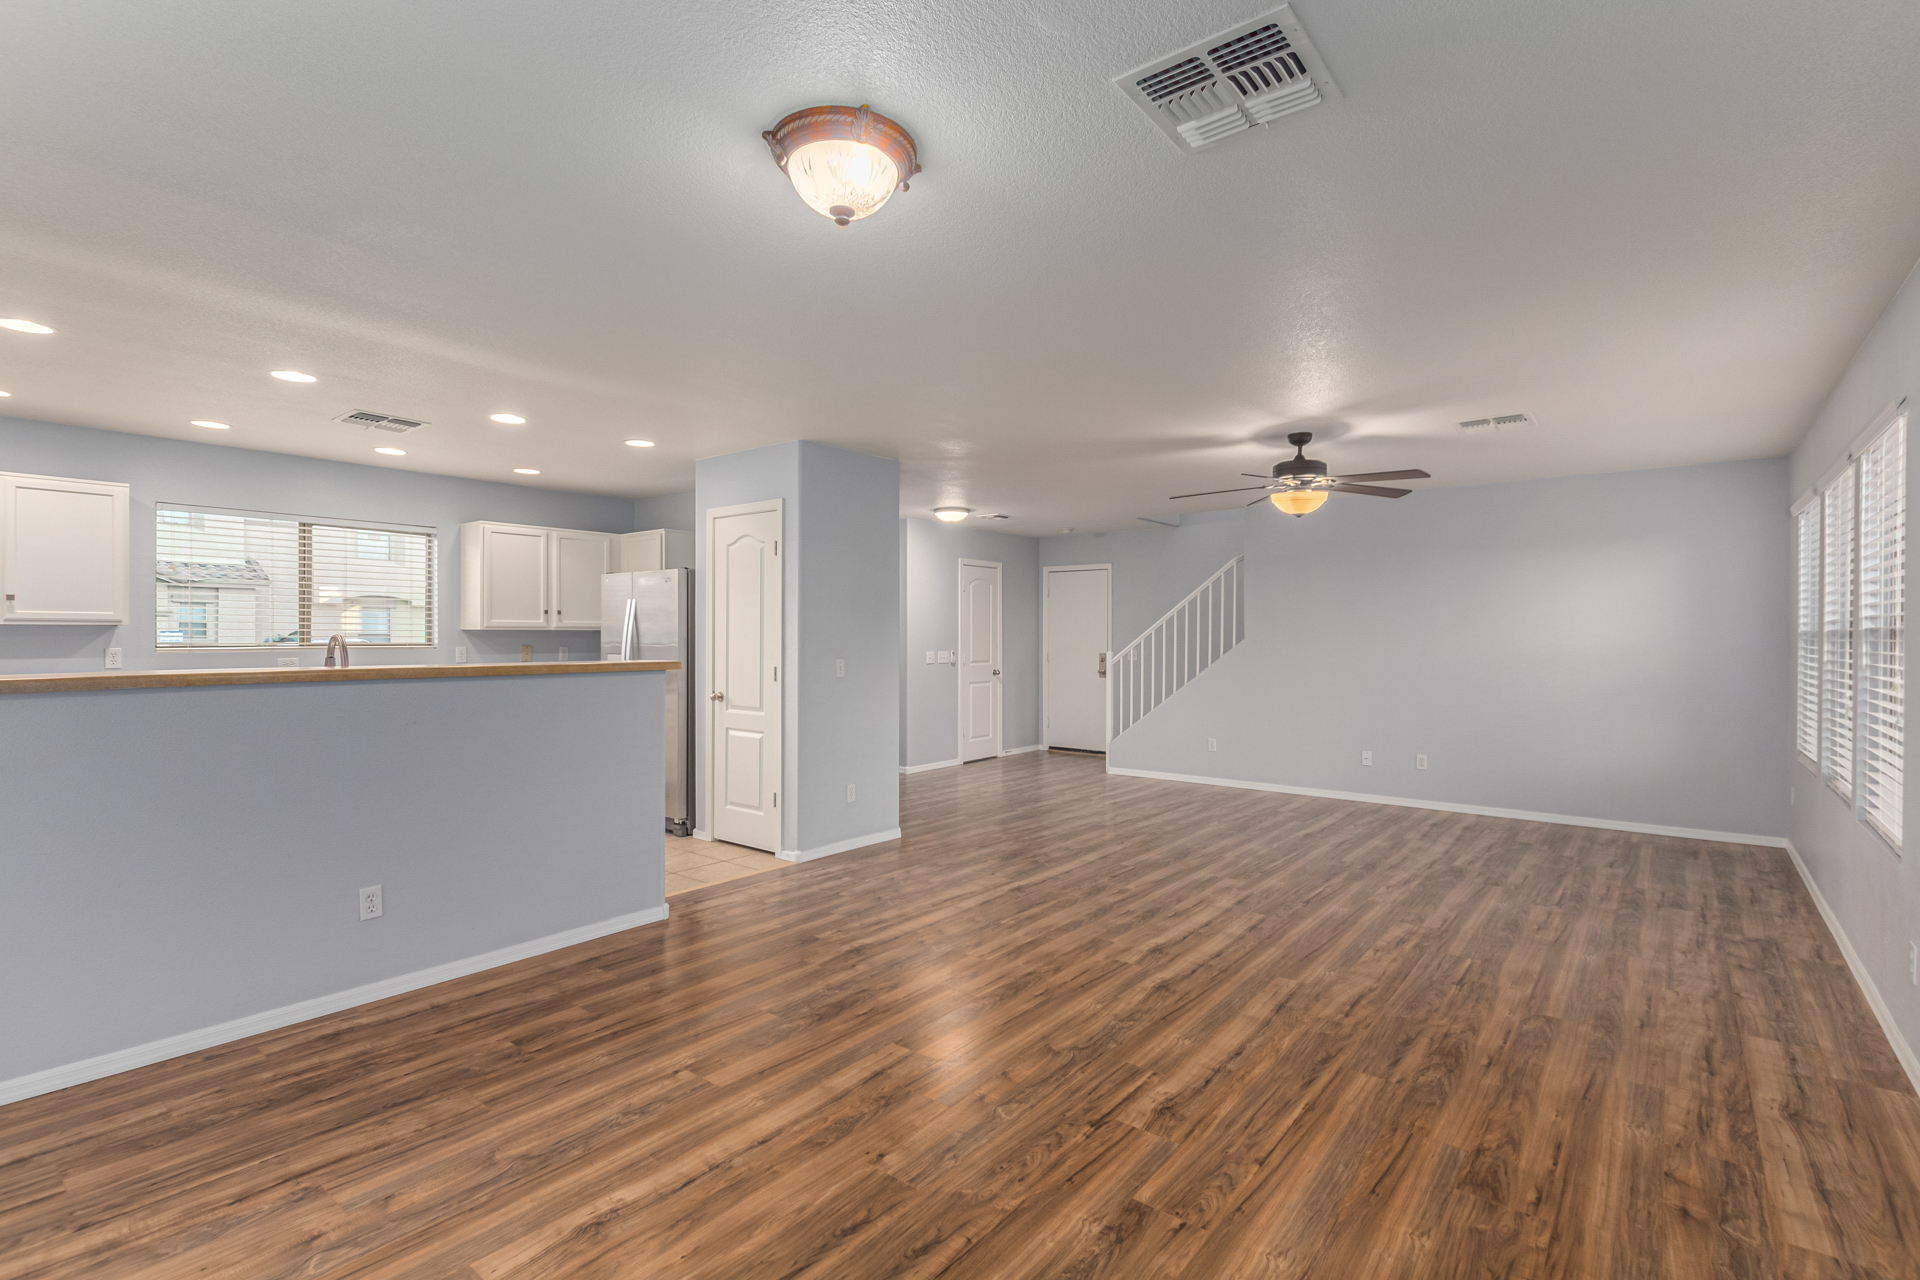
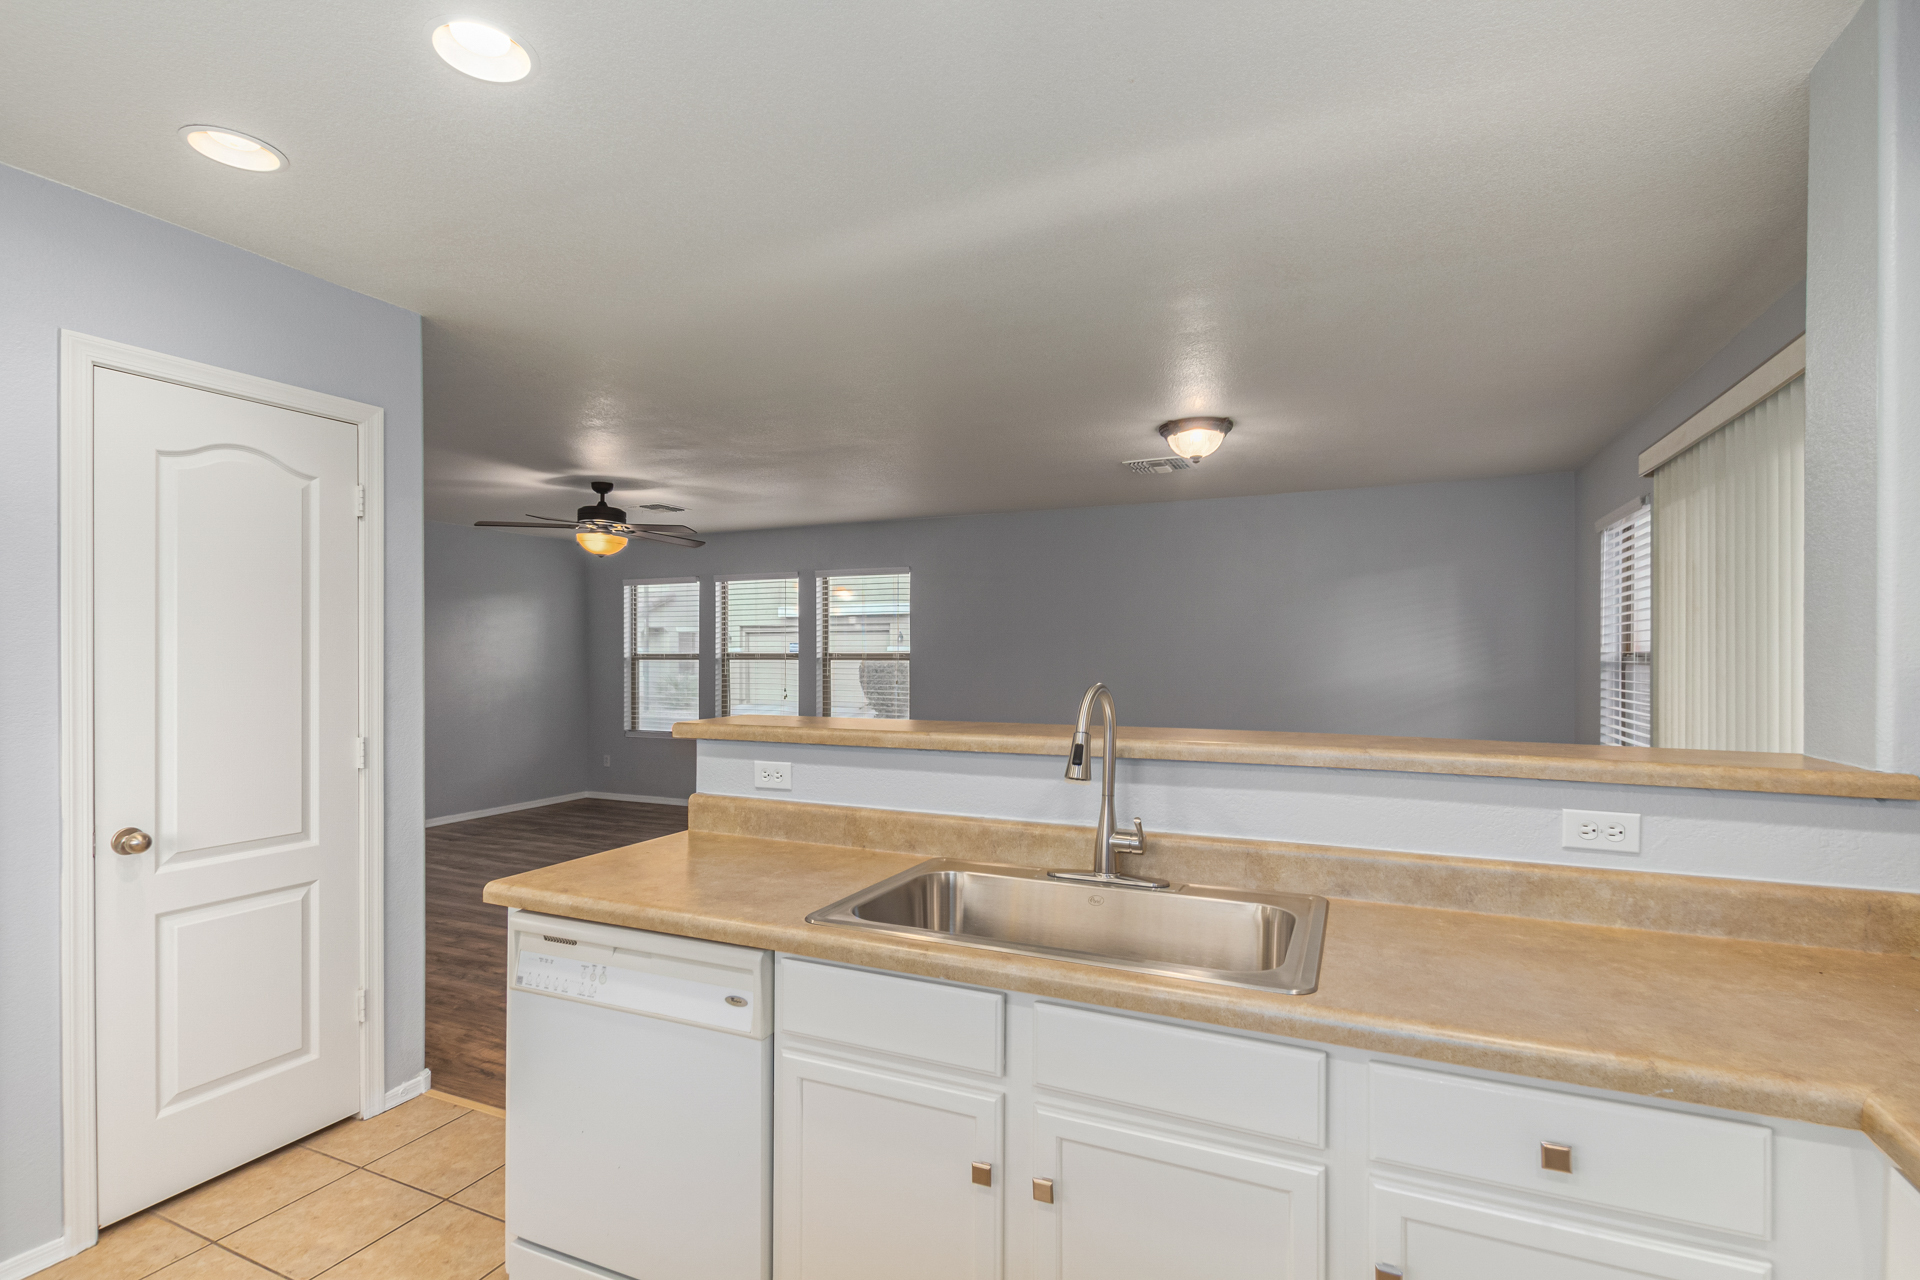
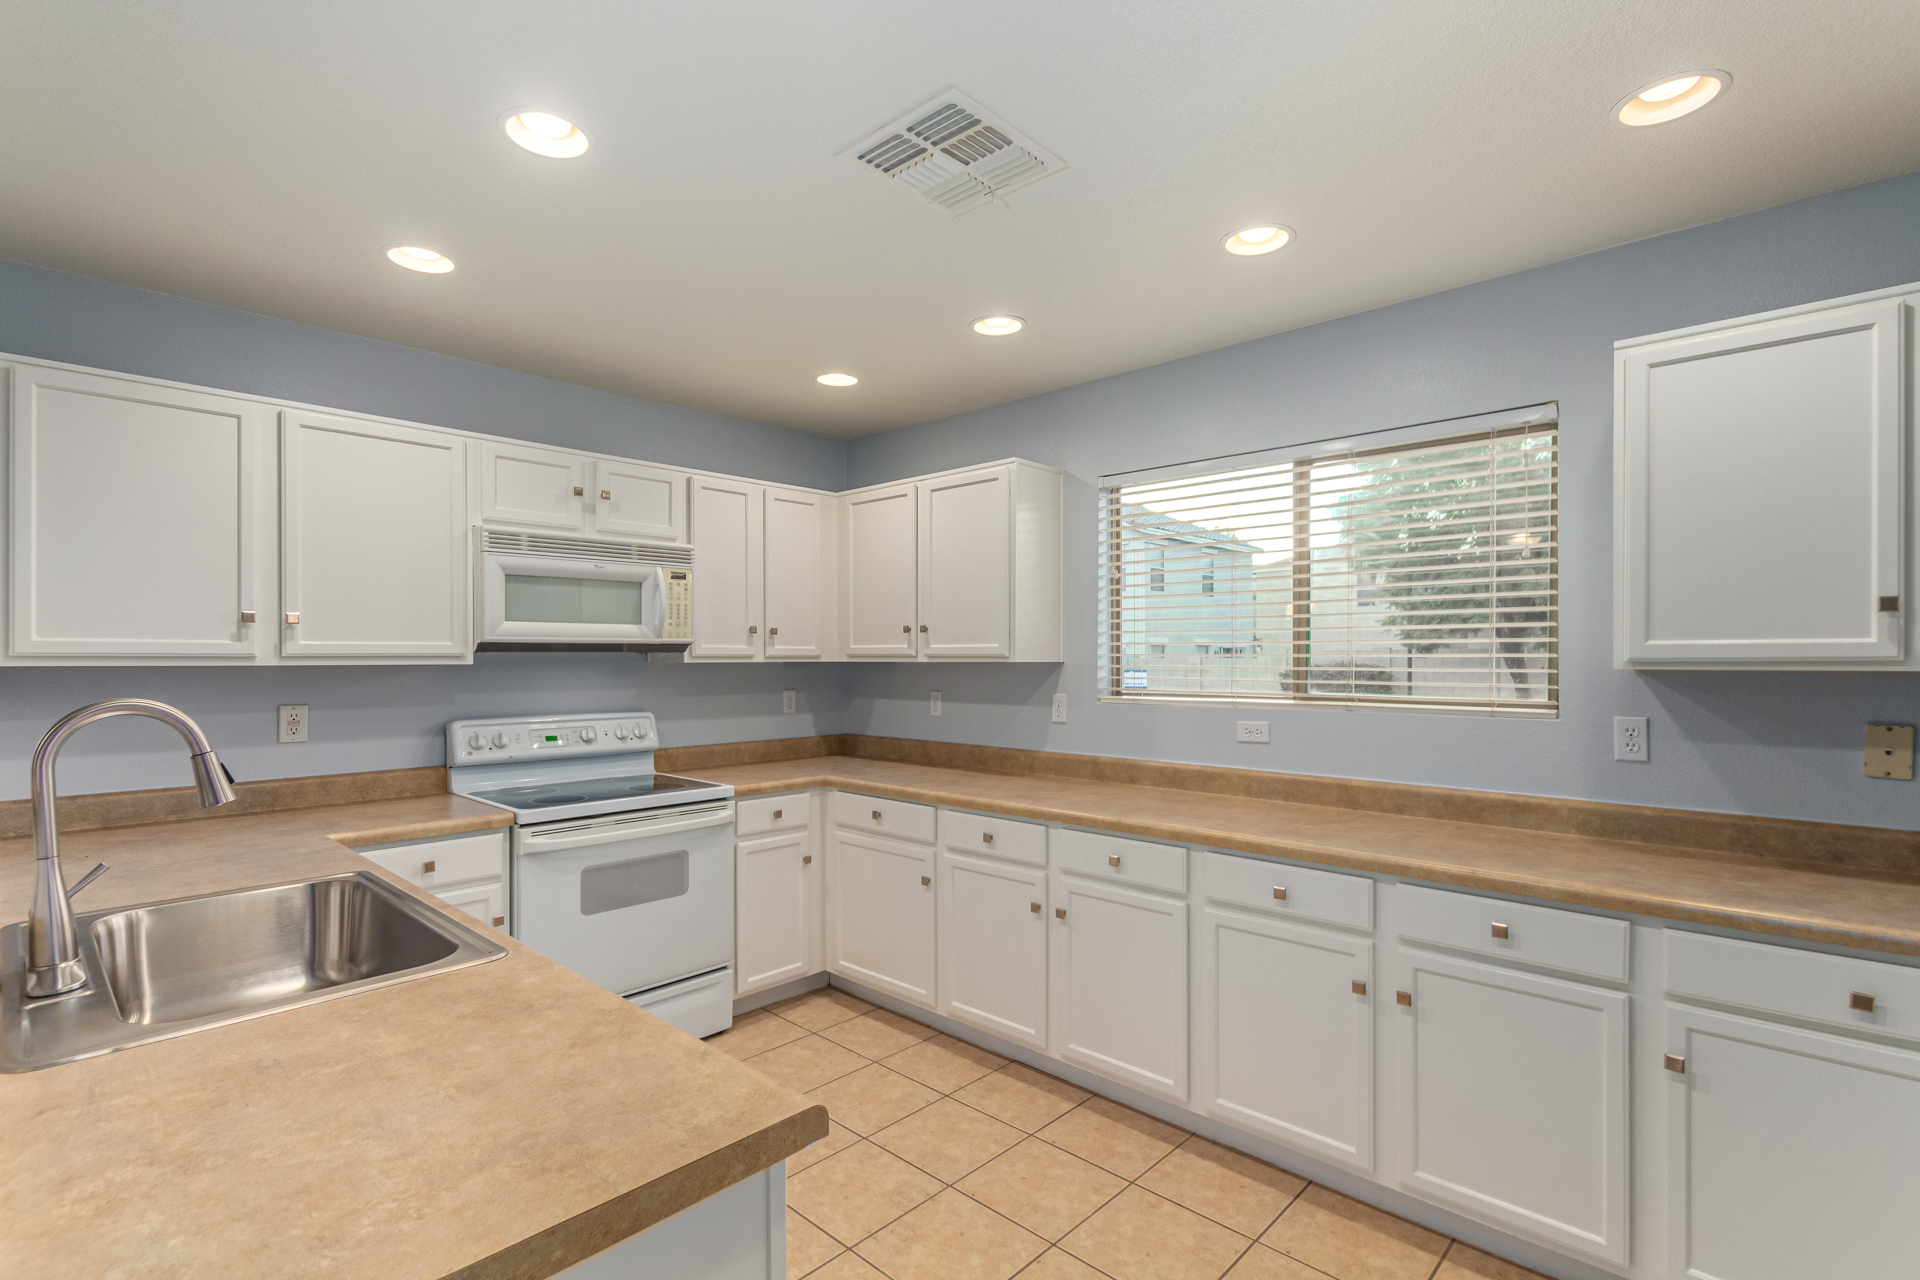
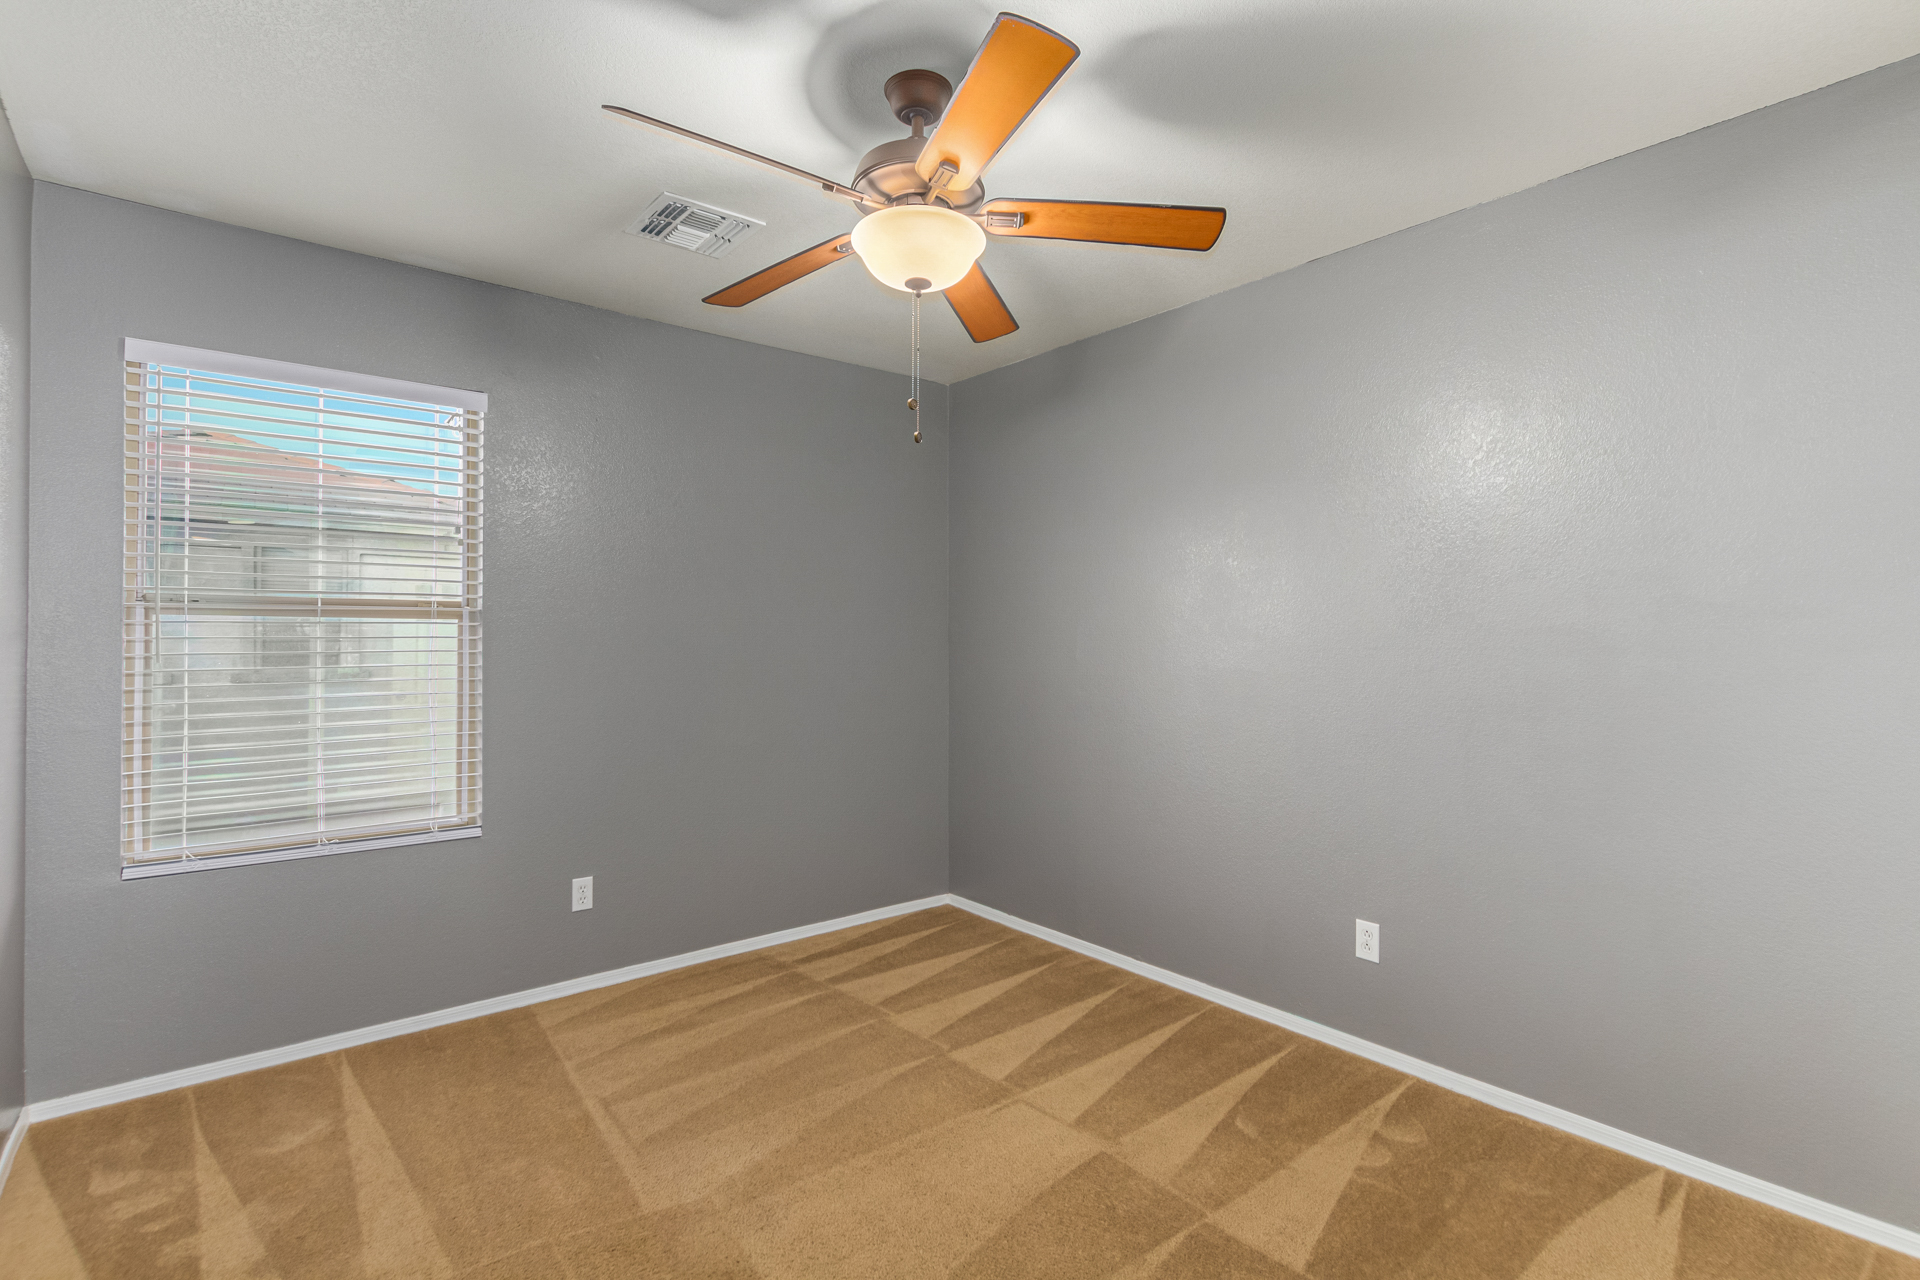
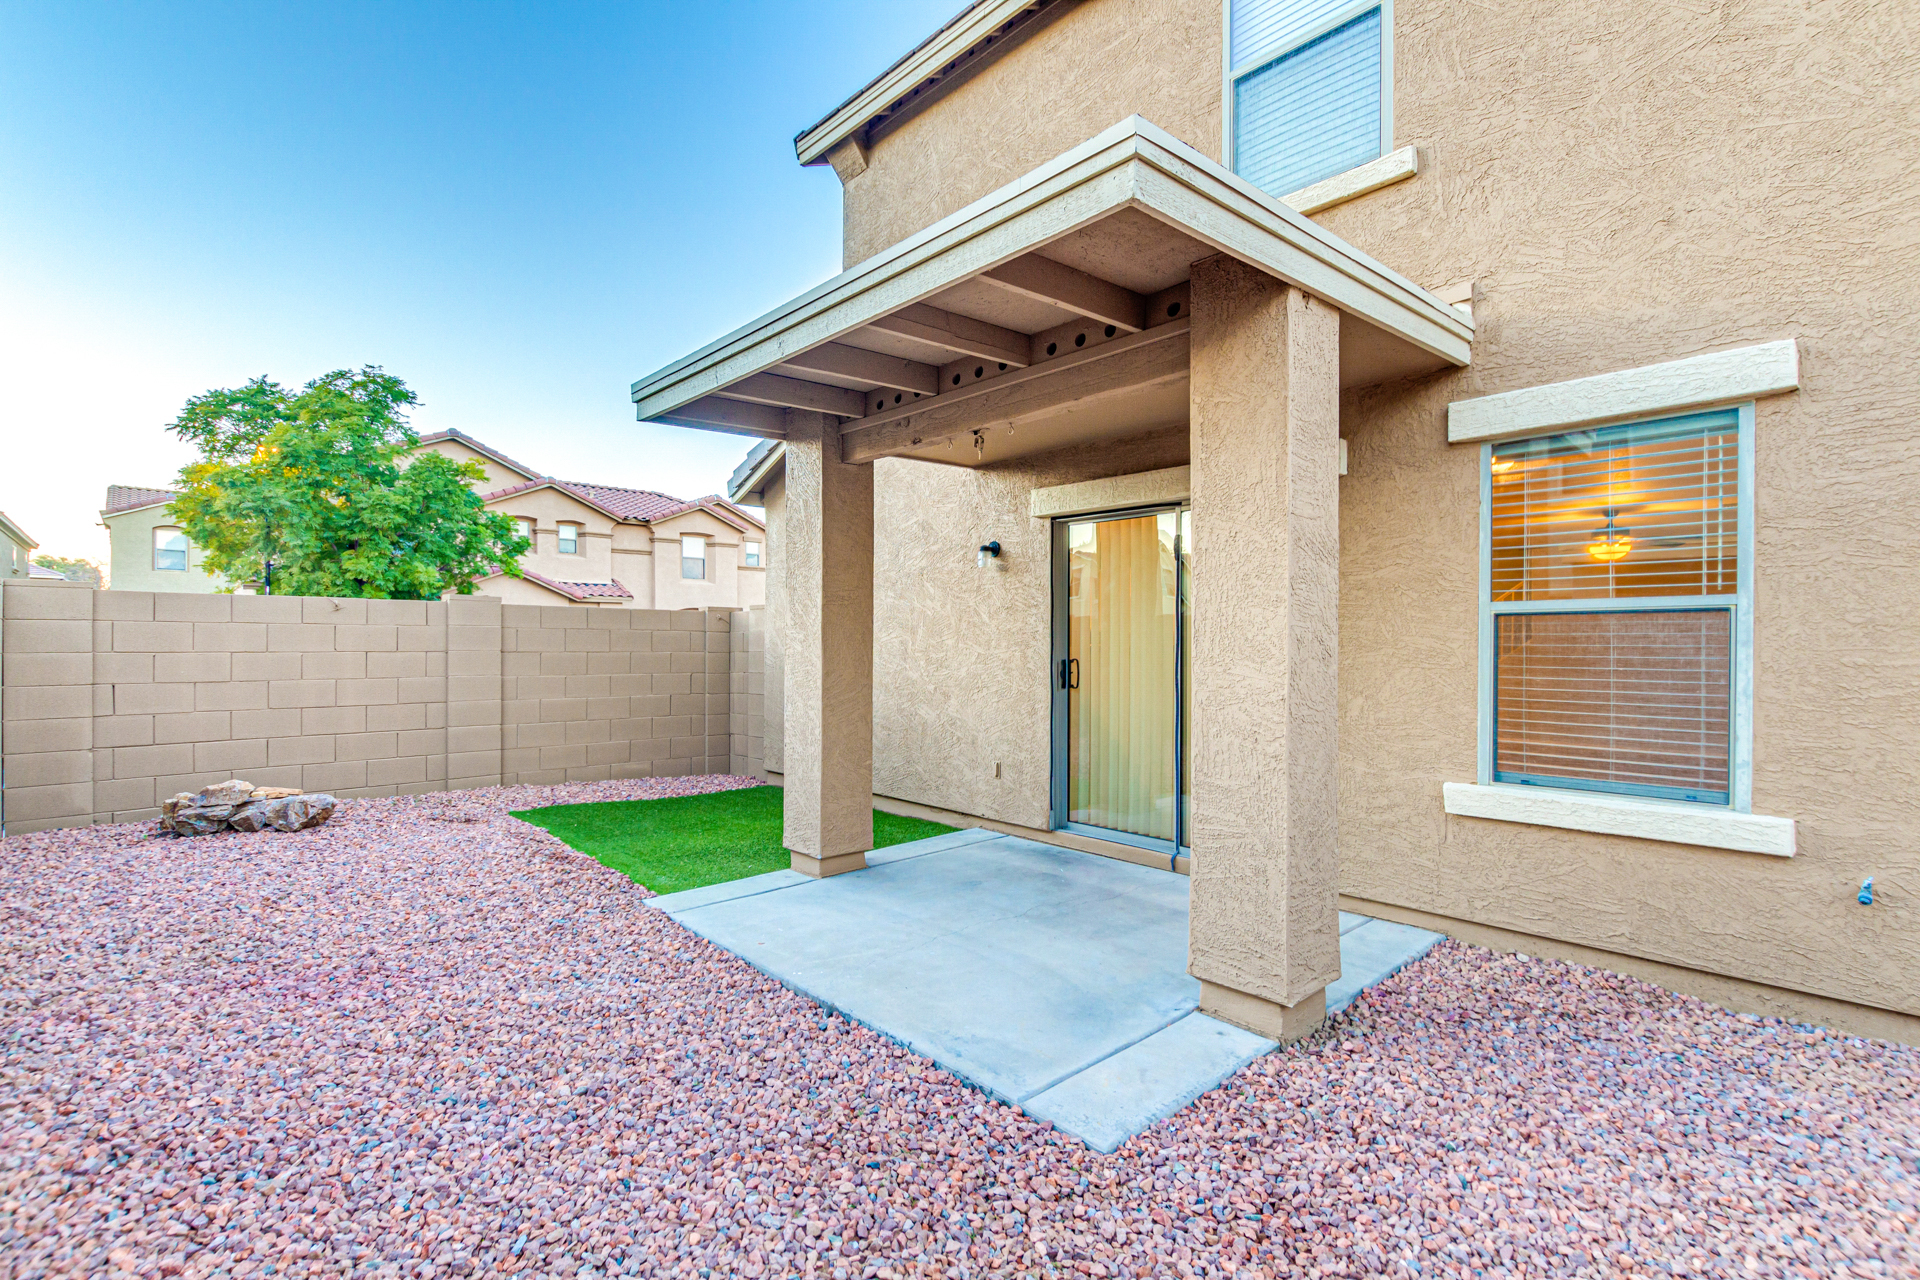
1. How fast are homes selling? Average number of days on market is 27 (down 2 days from last year)
2. How many homes are for sale? We currently have 8,541 properties for sale (up 15% from last year)
3. What is the average sales price? Homes across the city are selling for $591,709 (up 19.6% from last year)
April’s supply was down 1.9% from April 2021 (with 11,181 homes listed for sale last month) and April’s demand was down 8.8% from April 2021 (with 9,306 homes sold last month). Average home values increased almost 20% in the last year but we still have only 0.93 months of inventory, which is up from 0.82 this time last year. Under 2 months supply is a seller’s market, between 2 and 4 months is a balanced market, and over 4 months is a buyer’s market. The fact we constantly remain under 1 month of inventory (though on the rise) is impressive.
What is going on? Over the past few years, we repeatedly described our local housing market as on fire. We concluded each newsletter with a familiar refrain: sellers’ markets don’t last forever and the market will eventually shift but we don’t know when. We routinely referenced interest rates as the wildcard. The when is probably now. Mortgage rates hit a new 13-year high, with the 30-year fixed-rate mortgage averaging 5.91%, up from 2.96% a year ago. With much higher monthly payments, buyers who don’t have savings for a large down payment risk being priced out of the market. Unfortunately, this is occurring just as rents reach an all-time high, making saving more difficult for those looking to buy their first home. Recently released numbers from the Bureau of Labor Statistics show Phoenix leading the nation with prices 11% higher this April compared to April 2021. When you combine rising interest rates, record home prices and record inflation, homebuyer faces a triple-edged sword.
What is going to happen? When the housing market moves from a sellers’ market to a balanced market, demand softens first- and a drop in demand is what we’re seeing. On May 1, demand was down 7.9% year over year, with supply up 10.6% year over year. Today, supply is 21% higher than last year, suggesting our market is cooling. This means current listings are staying active longer and inventory is starting to build in most (but not all) segments. While the number of homes for sale remains very far below normal, we have seen before how it can increase sharply if more sellers emerge just as demand is declining.
Parting thoughts Fannie Mae’s Senior Vice President and Chief Economist released a statement: In April, the Home Purchase Sentiment Index fell to its lowest level since the first few months of the pandemic, as consumers continue to report difficult homebuying conditions amid the budget-tightening constraints of inflation, higher mortgage rates and high home price appreciation. The current lack of entry-level supply and the rapid uptick in mortgage rates appear to be adversely impacting potential first-time homebuyers, evidenced by the larger share of younger responses (aged 18-34) reporting that it’s a “bad time to buy a home.”
Data from ARMLS® COPYRIGHT 2022.